Two common ways to estimate the center of a set of data are the sample mean and the sample median. The sample mean is sometimes more efficient, but the sample median is always more robust. (I’m going to cut to the chase first, then go back and define basic terms like “median” and “robust” below.)
When the data come from distributions with thick tails, the sample median is more efficient. When the data come from distributions with a thin tail, like the normal, the sample mean is more efficient. The Student-t distribution illustrates both since it goes from having thick tails to having thinner tails as the degrees of freedom, denoted ν, increase.
When ν = 1, the Student-t is a Cauchy distribution and the sample mean wanders around without converging to anything, though the sample median behaves well. As ν increases, the Student-t becomes more like the normal and the relative efficiency of the sample median decreases.
Here is a plot of the asymptotic relative efficiency (ARE) of the median compared to the mean for samples from a Student-t distribution as a function of the degrees of freedom ν. The vertical axis is ARE and the horizontal axis is ν.
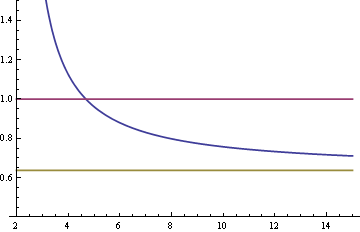
The curve crosses the top horizontal line at 4.67879. For values of ν less than that cutoff, the median is more efficient. For larger values of ν, the mean is more efficient. As ν gets larger, the relative efficiency of the median approaches the corresponding relative efficiency for the normal, 2/π = 0.63662, indicated by the bottom horizontal line.
Backing up
The sample mean is just the average of the sample values. The median is the middle value when the data are sorted.
Since data have random noise, statistics based on the data are also random. Statistics are generally less random than the data they’re computed from, but they’re still random. If you were to compute the mean, for example, many times, you’d get a different result each time. The estimates bounce around. But there are multiple ways of estimating the same thing, and some ways give estimates bounce around less than others. These are said to be more efficient. If your data come from a normal example, the sample median bounces around about 25% more than the sample mean. (The variance of the estimates is about 57% greater, so the standard deviations are about 25% greater.)
But what if you’re wrong? What if you think the data are coming from a normal distribution but they’re not. Maybe they’re coming from another distribution, say a Student-t. Or maybe they’re coming from a mixture of normals. Say 99% of the time the samples come from a normal distribution with one mean, but 1% of the time they come from a normal distribution with another mean. Now what happens? That is the question robustness is concerned with.
Say you have 100 data points, and one of them is replaced with ∞. What happens to the average? It becomes infinite. What happens to the median? Either not much or nothing at all depending on which data point was changed. The sample median is more robust than the mean because it is more resilient to this kind of change.
Asymptotic relative efficiency (ARE) is a way of measuring how much statistics bounce around as the amount of data increases. If I take n data points and look at √n times the difference between my estimator and the thing I’m estimating, often that becomes approximately normally distributed as n increases. If I do that for two different estimators, I can take the ratio of the variances of the normal distributions that this process produces for each. That’s the asymptotic relative efficiency.
Often efficiency and robustness are in tension and you have to decide how much efficiency you’re willing to trade off for how much robustness. ARE gives you a way of measuring the loss in efficiency if you’re right about the distribution of the data but choose a more robust, more cautious estimator. Of course if you’re significantly wrong about the distribution of the data (and often you are!) then you’re better off with the more robust estimator.
Interesting idea and clearly explained.
Thanks.
…can you elaborate more,about the use of mean of mean and the median in measuring the variance? is it possible to used median to to calculate the variance?
First, a very clear discussion: Well done!
Second, do you know that pi/2 is also the solution for Buffon’s needle problem when the length of the needle = the distance between the lines?