Imagine you picked up a dictionary and found that the pages with A’s were dirty and the Z’s were clean. In between there was a gradual transition with the pages becoming cleaner as you progressed through the alphabet. You might conclude that people have been looking up a lot of words that begin with letters near the beginning of the alphabet and not many near the end.
That’s what Simon Newcomb did in 1881, only he was looking at tables of logarithms. He concluded that people were most interested in looking up the logarithms of numbers that began with 1 and progressively less interested in logarithms of numbers beginning with larger digits. This sounds absolutely bizarre, but he was right. The pattern he described has been repeatedly observed and is called Benford’s law. (Benford re-discovered the same principle in 1938, and per Stigler’s law, Newcomb’s observation was named after Benford.)
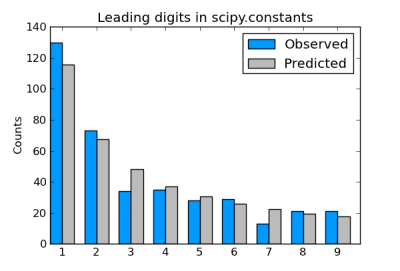
Benford’s law predicts that for data sets such as collections of physical constants, about 30% of the numbers will begin with 1 down to about 5% starting with 8 or 9. To be precise, it says the leading digit will be d with probability log10(1 + 1/d). For a good explanation of Benford’s law, see TAOCP volume 2.
A couple days ago I blogged about using SciPy’s collection of physical constants to look for values that were approximately factorials. Let’s look at that set of constants again and see whether the most significant digits of these constants follows Benford’s law.
Here’s a bar chart comparing the actual number of constants starting with each digit to the results we would expect from Benford’s law.
Here’s the code that was used to create the data for the chart.
from math import log10, floor
from scipy.constants import codata

def most_significant_digit(x):
    e = floor(log10(x))
    return int(x*10**-e)

# count how many constants have each leading digit
count = [0]*10
d = codata.physical_constants
for c in d:
    (value, unit, uncertainty) = d[ c ]
    x = abs(value)
    count[ most_significant_digit(x) ] += 1
total = sum(count)

# expected number of each leading digit per Benford's law
benford = [total*log10(1 + 1./i) for i in range(1, 10)]
The chart itself was produced using matplotlib, starting with this sample code.
The actual counts we see in scipy.constants line up fairly well with the predictions from Benford’s law. The results are much closer to Benford’s prediction than to the uniform distribution that you might have expected before hearing of Benford’s law.
Update: See the next post for an explanation of why factorials also follow Benford’s law.
I’ve heard that the Internal Revenue Service of the USA uses a statistic related to Benford’s Law to help detect tax fraud by detecting likely made-up numbers.
Just like most people when asked to make up data from a series of coin flips fail to produce enough long chains of consecutive identical results, people making up financial data fail to follow Benford’s law, instead assigning about equal numbers of each digit to the leading place.
People are usually pretty bad at simulating randomness, and are often fooled by the nature of randomness into thinking that random phenomena are not random. For example, since people generally underestimate the probability of long repeats of the same result in coin flips, when they observe one they tend to conclude that the coin flipper is on a ‘streak’ (in gambling contexts) or that the coin is not truly random. I see the latter mostly in electronic gaming, where to be fair the results are not truly random but are (one hopes) indistinguishable from true randomness.
I recently saw a study demonstrating the people are good at instinctively guessing that certain decks of cards used in a game are not random, but I wonder about the power of the study :-)
The agreement does not look that great to me, perhaps a larger sample is needed (where are the error bars)? I initially thought that the fit for leading digits of numeric literals looked good but further analysis suggested otherwise :-(
The deviation of accounting figures from Benford’s law seems to be growing over time. I saw a plot of Greek government financial data a while ago and it had significantly more deviation from Benford’s law than any other EU country.
I imagine then that people who pick numbers for their passwords might fall into the same trap.
There was a fairly vituperous paper by Cosma Shalizi et al. that got some press for showing how easy it is to mistake an empirical distribution to be generated by a power law.
http://arxiv.org/abs/0706.1062
From eyeballing your chart, everything but 3 and 7 look reasonably good. Do 3 & 7 rule out a Benford’s Law conclusion?
I recently published a book on Benford’s Law (Benford’s Law: Applications for forensic accounting, auditing, and fraud detection, Wiley, 2012). John (above) makes a good point about tax evasion and the book includes tax evasion applications, earth science applications, and plenty of fraud studies with data. There are also 3 chapters on the mathematics underlying Benford’s Law. The book shows how to analyze data in Excel and/or Access. The companion site http://www.nigrini.com/benfordslaw.htm has free Excel templates, data sets, photos, and other items including my first article from 1993.
To Mark Nigrini: Stop spamming your book all over the web and blog comments. It’s annoying
I’m OK with promotional comments as long as they’re on-topic, so Mark Nigrini’s comment is fine with me.
I get lots of off-topic promotional comments and report them as spam.