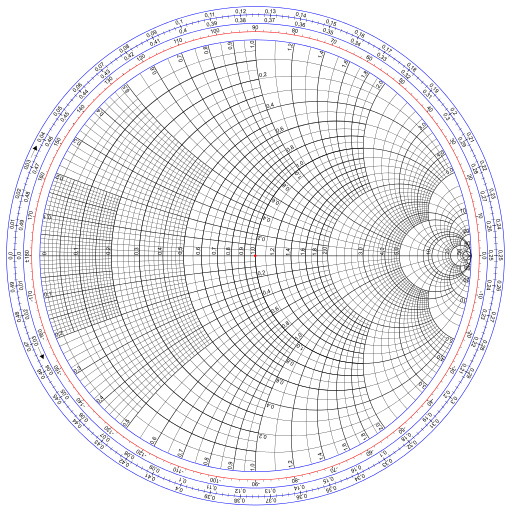
The previous post looked at the basics of how to create a Smith chart. The Smith chart is the image of a Cartesian grid in the right half-plane under the function
f(z) = (z − 1)/(z + 1).
At the end of the post I noted that evenly distributed grid lines in the z plane result in very unevenly spaced circles on the Smith chart in the w plane. We can fill in the Smith chart how we please by working backward, starting from a desired spacing of circles in the chart and tracing them back to the z plane.
The inverse of the function f is
g(w) = (1 + w)/(1 − w).
Complete circles
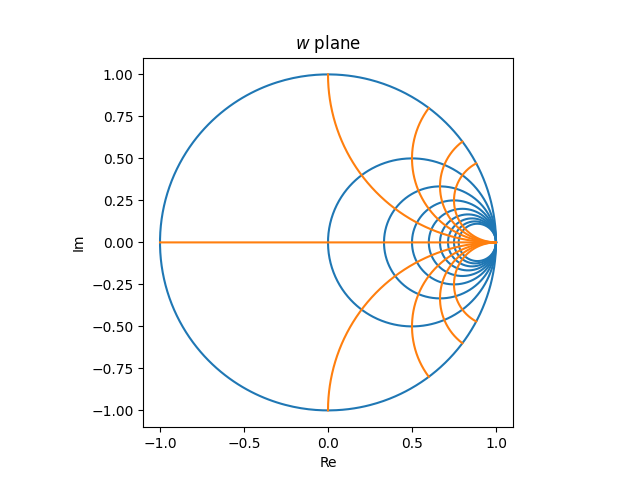
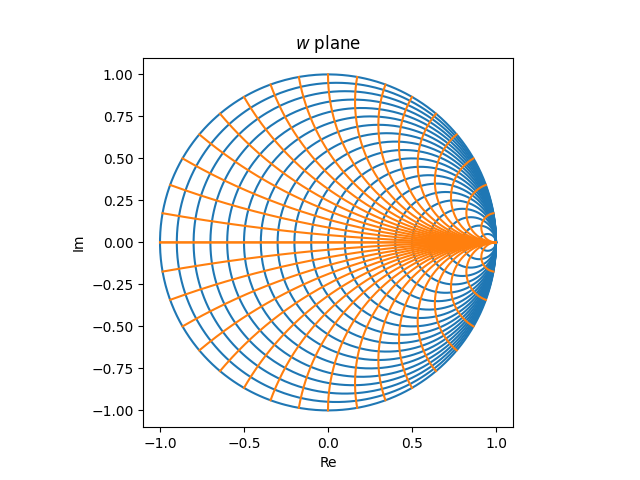
The Smith chart contains two kinds of circles: circles that fit entirely inside the chart, which are the images of vertical lines in the z plane, and circles that extend outside the chart, which are the images of horizontal lines. In the image below, the former are blue and the latter are orange.
We can space out the complete (blue) circles how we wish and use the inverse transformation g(w) to determine the corresponding spacing of the vertical lines in the z plane. If we take a point w0 along the horizontal diameter of the Smith chart, w0 is a real number, and so is its inverse z0 = g(w0).
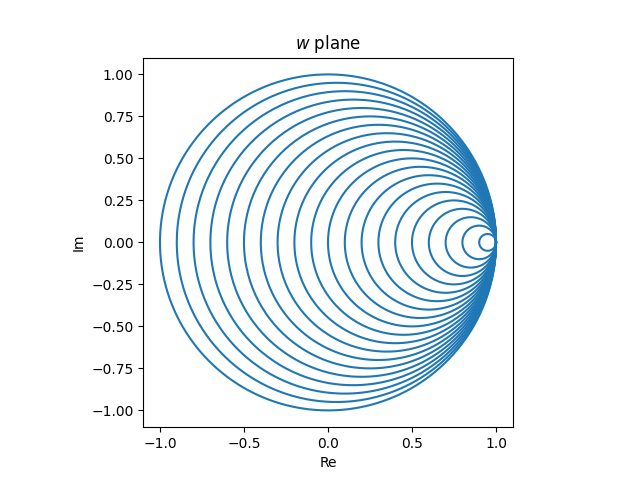
So if we’d like the intersections of the complete circles with the diameter to be uniformly spaced, we pick uniformly spaced points wi and use as our vertical lines in the z plane the lines with real part g(wi).
Here’s the image we’d get if we wanted circles passing through the diameter of the Smith chart at increments of 0.1.
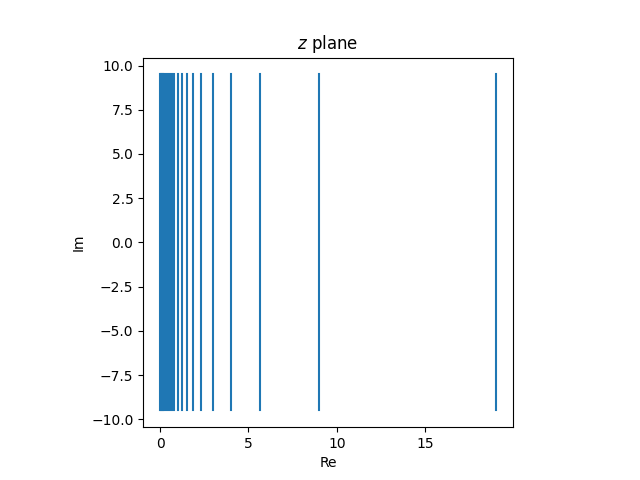
And here’s the corresponding set of vertical lines in the z plane that would produce these circles.
Incomplete circles
Now onto the incomplete circles, the orange circles in the graph above that are perpendicular to the blue circles.
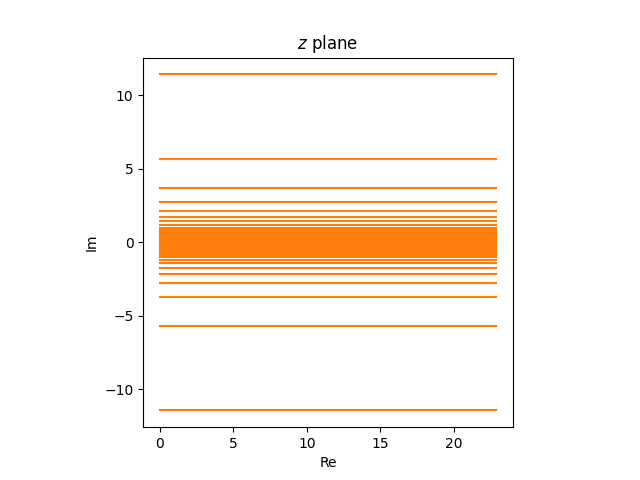
As we showed in the previous post, the outer rim of the Smith chart is the image of the imaginary axis in the z plane under the function f(z). So if we pick a point wi on the rim that we’d like a circle to pass through, we use the horizontal line with imaginary part equal to g(wi).
So if we wanted orange circles to cross the boundary of the Smith chart every 10°, we pick w‘s from the interval [−π, π] spaced π/18 apart.
We can create these lines on the Smith chart below
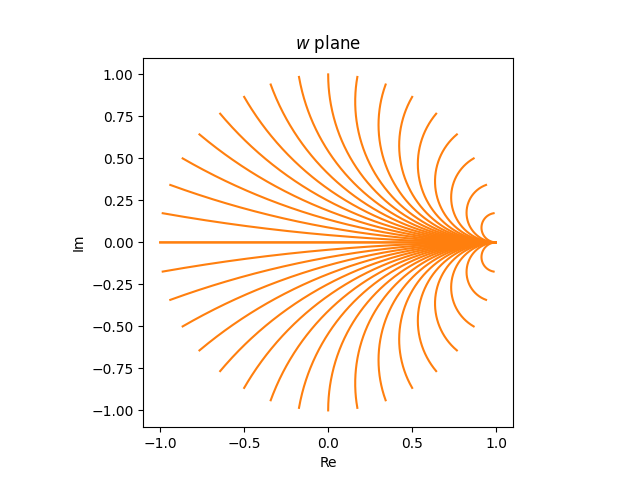
from these lines in the z plane.
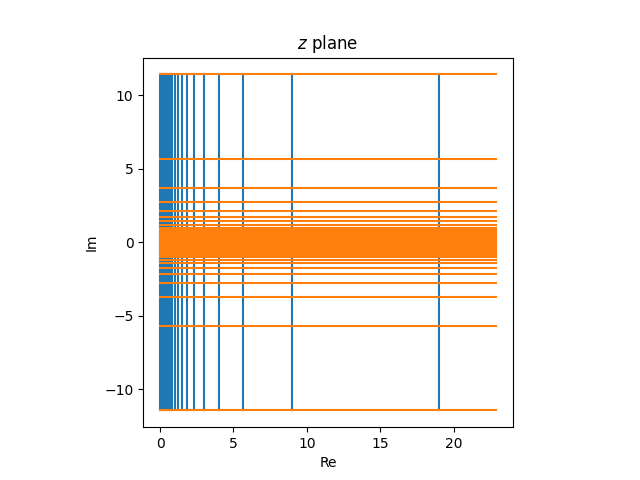
Putting it all together
The image of this grid in the z plane
is the following in the w plane.
Compromise
The Smith charts printed in textbooks use some compromise between even spacing in the w plane and even spacing in the z plane.