As mentioned in the previous post, most of the area in the Mandelbrot set comes from two regions. The largest is the blue cardioid region below and the next largest is the orange disk.
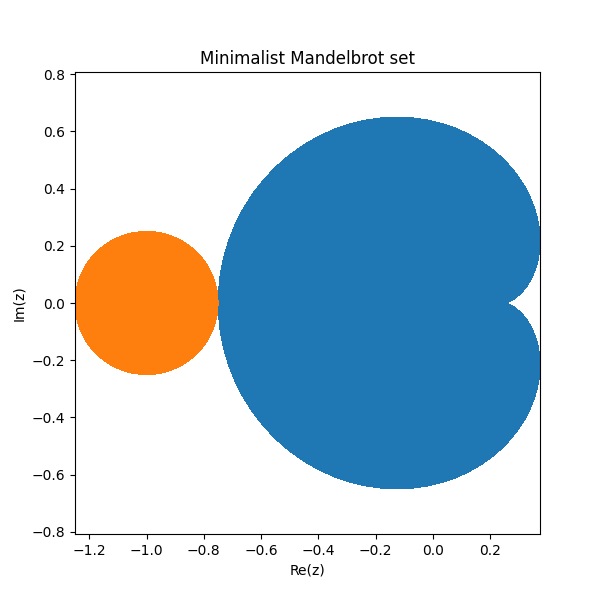
The blue cardioid is the set of points c such that iterations of z² + c converge to a fixed point. The orange disk is the set of points that converge to a cycle of period 2.
We can watch the convergence by picking a point and drawing a line between the iterates with the following Python function.
import matplotlib.pyplot as plt

def plot_iterates(c):
    f = lambda z: z**2 + c
    z = c
    s = [z]
    for i in range(1, 20):
        z = f(z)
        s.append(z)
        plt.plot([s[i-1].real, s[i].real], [s[i-1].imag, s[i].imag], color="C0")
    plt.gca().set_aspect("equal")
    plt.show()
First, we start with a point in the cardioid that converges to a fixed point. We could say it converges to a cycle of period 1.
plot_iterates(0.05 + 0.3j)
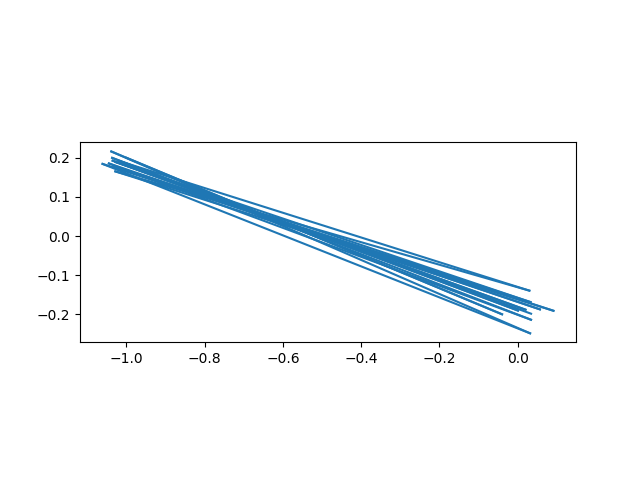
Next, lets start at a point in the orange disk with period 2.
plot_iterates(-1 + 0.2j)
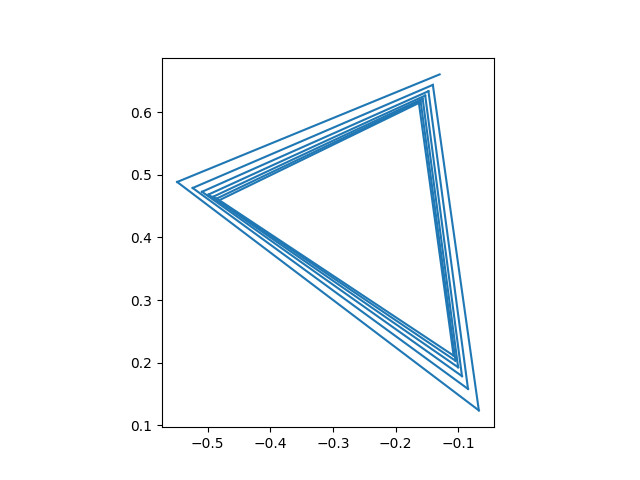
We can find points with any period n. Here’s one of period 3.
plot_iterates(-0.13 + 0.66j)
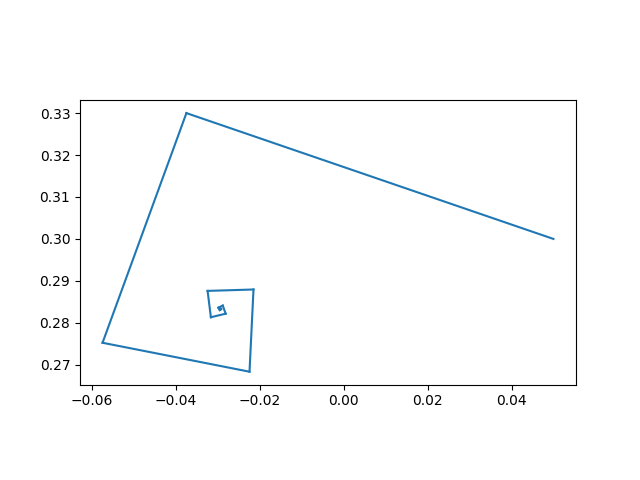
And here’s one of period 4.
plot_iterates(0.256 + 0.55j)
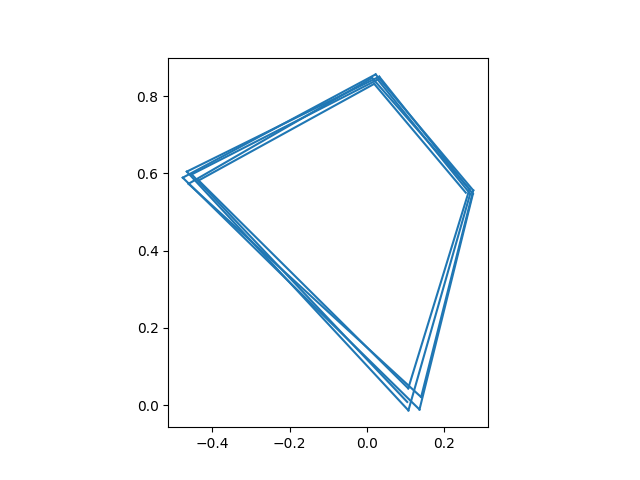
The values of c that converge to a cycle with period q are “bulbs” tangent to the cardioid. There are φ(q) bulbs where φ is Euler’s totient function, i.e. φ(q) is the number of positive integers less than and relatively prime to q. The orange disk is the first bulb, the only one of its kind because φ(2) = 1. There are two bulbs with period 3 because φ(3) = 2.
For every p relatively prime to q there is a bulb tangent to the cardioid at w(1 − w) where
w = ½ exp(2πip/q)
and the diameter of the bulb is approximately 1/q.
These bulbs don’t account for everything in the Mandelbrot set. There’s a lot more to explore.
By the way, here is a plot of the Mandelbrot set created by selecting values of c at random and testing whether iterations of z² + c remain bounded.