Isn’t linear regression trivial?
When I was a postdoc I knew little about statistics. As John Tukey said, the first time I was in a statistics course I was there to teach it.
I heard that there was a course in linear regression and was dumbfounded. I asked one of the statisticians “There’s an entire course in fitting straight lines? What am I missing?”
I’d seen the derivation of a least-squares line as an exercise in a calculus course. It might even have been an exercise in the course I was teaching. Just write down the squared error, take partial derivatives, and set them to zero. How could you stretch that into a semester-long course?
As my very patient colleague explained, linear regression is much more than fitting a line to data. Regression does fit curves to data, but it’s much more than curve-fitting.
Estimating uncertainty
Curve-fitting gives you a curve, and that’s all. You specify what kind of curve you want to fit, and a measure of error, and find the parameters that minimize the error. You get the optimal parameters, but you don’t get any measure of the uncertainty associated with those parameters.
The central dogma of statistics is that you use probability distributions to model uncertainty. The starting point for a statistician coming to linear regression is a probability model. You assume that your outputs are linear functions of your inputs, plus some random error.
If you’re a frequentist, you say that your regression coefficients are constant but unknown numbers. If you’re a Bayesian, you say that there are random variables that represents your uncertainty regarding the coefficients. We’ll be frequentists for this page to keep things simpler. Often, as here, the difference between the two schools of thought doesn’t matter that much. But sometimes it does. That’s a topic for another page.
Estimating coefficients
Linear regression creates estimators for the unknown coefficients. It gives you point estimates for the coefficients. In fact, it gives you the best estimators in some technical sense. (The estimator is called BLUE: Best Linear Unbiased Estimator, best in the sense of minimum squared error within the class of unbiased estimators.) But more than point estimators, it also gives you the ability to form confidence intervals around these estimates.
Relation to naive curve fitting
The best linear unbiased estimator for the regression coefficients turns out to be the ordinary least squares (OLS) fit. This is the essence of the Gauss-Markov theorem. You do indeed fit the same like you would have if you’d simply looked for the least squares fit, with no mention of probability.
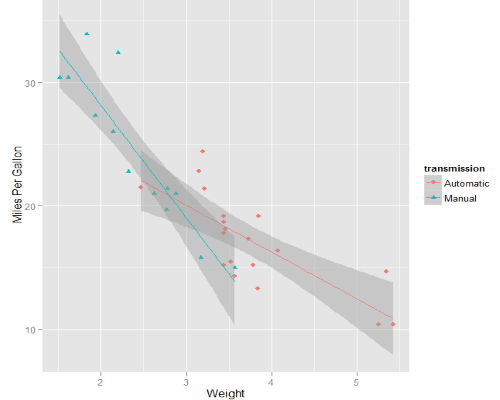
But it’s the probability framework that allows you to not just fit a line but also to understand the uncertainty in that fit. You understand that the coefficients you’ve computed aren’t “the” coefficients, only the ones that fit best for the data you happened to use. You understand that different data would have different random errors and would result in a different fit. How different? The probability model gives an idea of that.
Help with regression
If you’d like help with linear regression, or its many generalizations, please call or email to discuss your project.
Trusted consultants to some of the world’s leading companies
