Every probability and statistics class explains that the Student-t distribution is approximately normal, and everybody says the approximation is good when ν, the number of degrees of freedom in the t distribution, is 30 or larger.
This page looks a little more carefully into the error in this approximation.
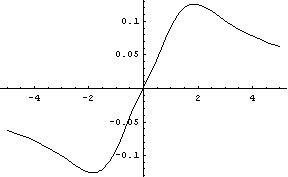
The following graph shows the CDF of a standard normal distribution minus the CDF of a student t with 1 degree of freedom (i.e. a Cauchy distribution).

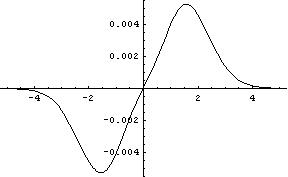
As ν increases, the amplitude of the error curve decreases, but the shape remains remarkably similar. The location of the maximum error begins at 1.85 when ν = 1and moves toward 1.56 when ν = 30.
The error curve for ν = 30 is below.

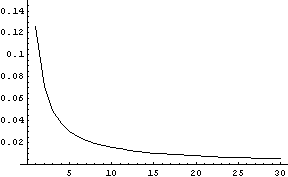
The maximum error begins at 0.1256 for ν = 1 and declines steadily to 0.005244 for ν = 30 as illustrated below.

This page has only considered the absolute error in the normal approximation to the t distribution. However, the relative error is huge in the tails.
See also notes on the normal approximation to the beta, binomial, gamma, and Poisson distributions.
