The previous post ended by plotting the error in approximating exp(x) with (2 + x)/(2 − x):
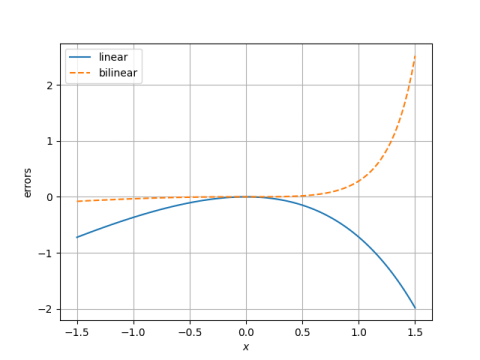
The error is much larger on the right end than the left. That made me wonder what the error might look like in the complex plane. Does the slice along real axis exhibit the minimum and maximum error, or are the other places in the unit disk where the error is even smaller or even larger?
Here’s a plot of the error over the unit square.
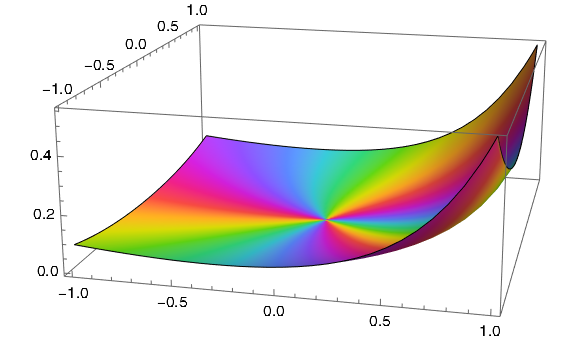
Here’s the Mathematica code that produced the plot.
    ComplexPlot3D[ Exp[z] - (2 + z)/(2 - z),
        {z, -1 - I, 1 + I}, PlotRange -> All]
It looks like the error might indeed be minimized and maximized along the real axis.
Incidentally, we can tell the error has a zero of order three at the origin because the sequence of colors, representing the phase, goes through three cycles.
We know the maximum and minimum of the absolute value of the error over the unit disk both occur on the boundary, i.e. on the unit circle, by the maximum modulus theorem. So we plot the error along the rim of the unit disk by letting z = exp(2πit) for 0 ≤ t ≤ 1.
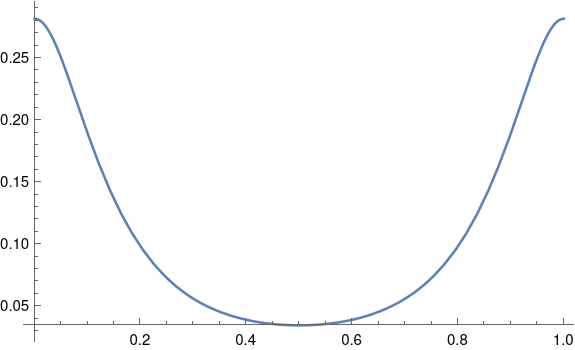
Here’s the code that produced the plot.
Plot[Abs[f[Exp[2 Pi I t]]], {t, 0, 1}]
It appears the error is maximized when t is 0 or 1, i.e. when z = 1, and minimized when t = 1/2, i.e. when z = −1.