A few days ago I wrote two posts about how to create a Smith chart, a graphical device used for impedance calculations. Then someone emailed me to point out the connection between the Smith chart and triangular numbers.
The Smith chart is the image of a rectangular grid in the right half-plane under the function
f(z) = (z − 1)/(z + 1).
If you subtract the values of f at consecutive integers, you get the reciprocal of a triangular number.
f(n) − f(n − 1) = 2/(n(n + 1)) = 1 / Tn
Or to put it another way,
f(n) − f(n − 1) = 1 / (1 + 2 + 3 + … + n).
In the first post on the Smith chart we showed that the function f maps vertical lines
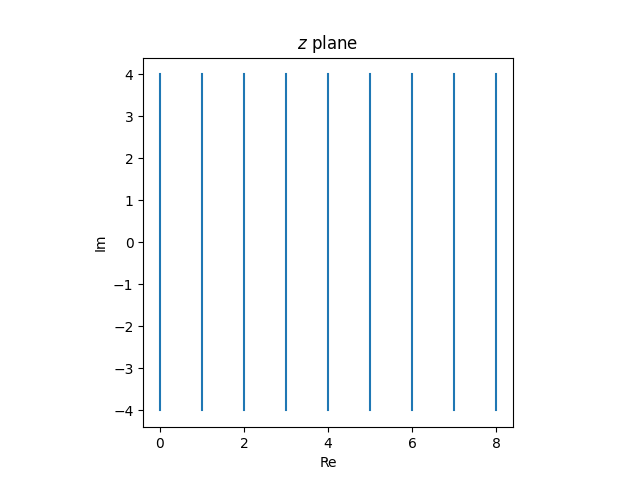
in the z plane to circles in the w plane all touching at w = 1.
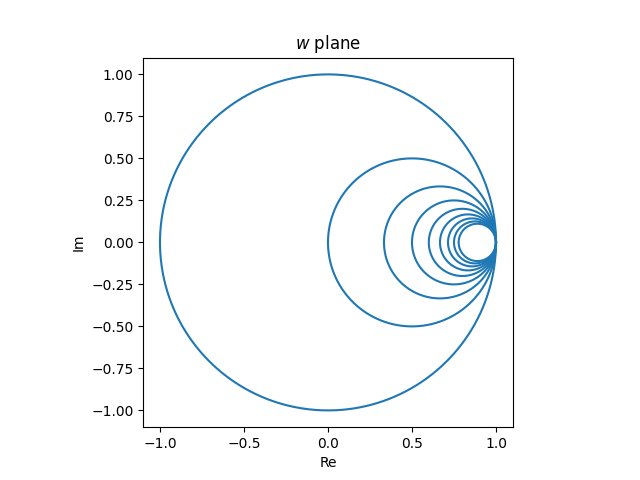
The circles are symmetric about the real axis and the diameter runs from f(n) to 1. The separation between the circles on the left side is thus
f(n) − f(n − 1) = 1 / Tn.
Number the circles starting from the outermost as 0, 1, 2, …. Then the maximum distance between circle n and circle n − 1 is 1 / Tn. You can see in the graph above that the distance between circle 0 and circle 1 is 1. It’s a little harder to see that the distance between circle 1 and circle 2 is 1/3. It looks like the distance between circles 2 and 3 is about half of that between circles 1 and 2, so it would be 1/6.