As the shape parameter in a gamma distribution grows larger, the distribution becomes more like a normal distribution. For example, the graph below shows the probability density function (PDF) of a gamma distribution with shape parameter 20.
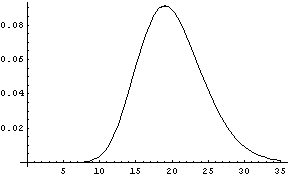
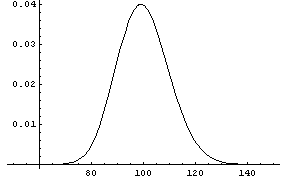
This looks something like a normal distribution, though it’s not quite symmetric. As the shape parameter increases, the distribution becomes more symmetric. Here’s the plot of the PDF of a gamma distribution with shape parameter 100.
In these notes we only consider gamma distributions with scale 1. However, the scale parameter has little effect on our discussion for the following reason. If X is a gamma random variable with shape α and scale 1, then βX is a gamma random variable with shape α and scale β. The scale parameter truly only effects the scale. In particular, this means that similar results to those presented here apply to the chi-squared (χ2) distribution since a chi-squared distribution with ν degrees of freedom is a gamma distribution with shape ν/2 and scale 2.
The sum of n independent exponential random variables with mean 1 is a gamma random variable with shape n. Therefore the Central Limit Theorem (CLT) tells us the error in a normal approximation to the gamma distribution is going to decrease like n-1/2 as the shape n grows large. The CLT also suggests that the error is going to decrease slowly since the exponential is very non-symmetric. But the CLT does not tell us everything. It is interesting to look at the behavior of the error as the shape grows.
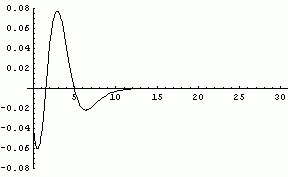
Now we concentrate on the difference between the CDF of a gamma distribution and the CDF of a normal distribution with the same mean and variance. Here is the difference in CDFs for a gamma with shape parameter 10 and the corresponding normal approximation.
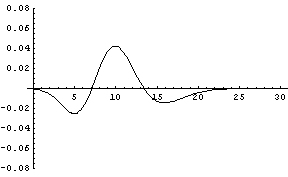
The error curve has this general appearance for all values of the shape parameter. As the shape parameter increases the curve shifts to the right, the amplitude decreases, and the curve widens. The animated image below shows how the curve moves as the shape parameter varies from 3 to 23. (The animation will only repeat once. To see it again, refresh the page.)
Here is a graph of the maximum error in the normal approximation to the gamma distribution as the shape parameter varies from 1 to 30. It follows is the n-1/2 curve that appears everywhere in statistics due to the Central Limit Theorem.
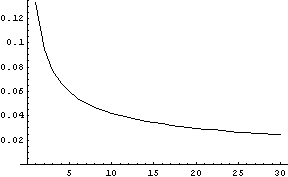
In each case, the maximum error for a gamma with shape parameter s occurs close to the point x = s.
(You could use the CLT along with the Berry-Esséen theorem to come up with an upper bound on the error that is indeed on the order of n-1/2. Use the fact the sum of n independent exponential random variables has a gamma(n) distribution. But the resulting upper bound is very pessimistic.)
Note that this page has only considered absolute error in the normal approximation. The relative error is a different story.
See also notes on the normal approximation to the beta, binomial, Poisson, and student-t distributions.