How would you model the time customers spend in a coffee shop?
This post is pure speculation based on no hard data whatsoever, which makes things considerably easier! If anyone has data or suggestions, please leave a comment. Here goes a first attempt.
The time people spend in a coffee shop depends on why they are there.
- Some grab their coffee and go.
- Some are there to visit with a friend.
- Some drink their coffee (alone) and leave.
- Some are there to work.
Each group would have its own time distribution, and the overall distribution would be a mixture of these distributions. Since I’m doing this for fun, I’ll ignore (1) and (2) and just concentrate on (3) and (4). I’ll also ignore complications such as how patterns change throughout the day and how they change according to the day of the week.
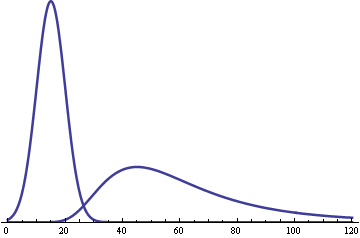
Say someone comes in alone to have a cup of coffee. Maybe they stay an average of 15 minutes. I’ll assume the time these folks spend in a coffee shop is normally distributed. Not many stay more than 30 minutes, so let’s say the standard deviation is 5 minutes. That would put only about 0.4% staying longer than 30 minutes. It would be more realistic to truncate the distribution at zero to eliminate the small probability of spending negative time in the coffee shop (!) and skew the distribution a little to the right, giving more probability to people staying more than 30 minutes.
The people who come to the coffee shop to work stay considerably longer than the folks who are just there to drink a cup of coffee. And their time distribution would be heavily skewed. These folks are unlikely to stay less than 30 minutes, so the distribution would drop off sharply on the left. There’s a wide variety of how long people might work, so I’d expect a long tail to the right. The inverse gamma distribution fits this description. Say there’s a 5% chance that a worker will stay less than 30 minutes, and a 5% chance they’ll stay more than two hours. Using this software to solve for parameters, we find a shape parameter of 6.047 and a scale parameter of 317.3 fits the time distribution in minutes. This distribution has a mean of about 63 minutes, which I suppose is reasonable.
Here’s what the graphs of the two distributions would look like: a symmetric distribution centered at 15 minutes for the drinkers and a skewed distribution centered around 63 minutes for the workers.

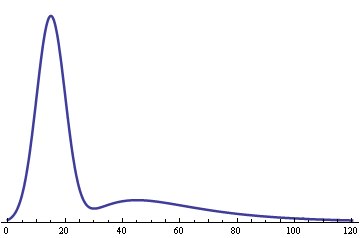
Now suppose 70% of customers are drinkers and 30% are workers. Then the mixture distribution would look like this.

As the percentage of workers goes down, so does the second hump in the graph. If a coffee shop had about 20% drinkers and 80% workers, the two humps would be about the same height.
How would you include people who come to a coffee shop with a friend?

Is this leading up to writing a grant for sitting in a coffee shop all day for six months?
Say, that’s a good idea! I hadn’t thought about that. Maybe I could write in some travel money so I could visit coffee shops in different cities. Wouldn’t want a regional bias in the data.
I spend a lot of time in coffee houses and rarely see people sit alone and drink coffee only. Either they order to go or come in with friends or something to do.
Modelling people who come in with friends is interesting since their behavior is not independent.
Wouldn’t Cox regression be a better starting point ?
i think i’ll plan on having *my* coffee
on the beaches of rio …
great post!
John, Nick Senofsky is interested in this…. can you forward this to him?
Oops, I didn’t read that very carefully, did I? Of course it’s not normal. It’s way right skewed.