Mills ratio and tail thickness

The Mills ratio [1] is the ratio of the CCDF to the PDF. That is, for a random variable X, the Mills ratio at x is the complementary cumulative distribution function divided by the density function. If the density function of X is f, then

m(x) = \frac{\int_x^\infty f(x)\, dx}{f(x)}

The Mills ratio highlights an important difference between the Student t distribution and the normal distribution.

Introductory statistics classes will say things like “you can approximate a t distribution with a normal if it has more than 30 degrees of freedom.” That may be true, depending on the application. A t(30) distribution and a normal distribution behave similarly in the middle but not in the tails.

Mills ratio plot for t(30) vs normal

The Mills ratio for a t distribution with ν degrees of freedom is asymptotically x/ν,  while the Mills ratio for a standard normal distribution is asymptotically 1/x. Note that increasing ν does make the Mills function smaller, but it still eventually grows linearly whereas the Mills function of a normal distribution decays linearly.

In general, the Mills ratio is a decreasing function for thin-tailed distributions and an increasing function for fat-tailed distributions. The exponential distribution is in the middle, with constant Mills function.

Related posts

[1] Named after John P. Mills, so there’s no apostrophe before the s.

Sigmas and Student

I saw something yesterday saying that the Japanese bond market had experienced a six standard deviation move. This brought to mind a post I’d written eight years ago.

All probability statements depend on a model. And if you’re probability model says an event had a probability six standard deviations from the mean, it’s more likely that your model is wrong than that you’ve actually seen something that rare. I expand on this idea here.

How likely is it that a sample from a random variable will be six standard deviations from its mean? If you have in mind a normal (Gaussian) distribution, as most people do, then the probability is on the order of 1 chance in 10,000,000. Six sigma events are not common for any distribution, but they’re not unheard of for distributions with heavy tails.

Let X be a random variable with a Student t distribution and ν degrees of freedom. When ν is small, i.e. no more than 2, the tails of X are so fat that the standard deviation doesn’t exist. As ν → ∞ the Student t distribution approaches the normal distribution. So in some sense this distribution interpolates between fat tails and thin tails.

What is the probability that X takes on a value more than six standard deviations from its mean at 0, i.e. what does the function

f(ν) = Prob(X > 6σ)

look like as a function of ν where σ² = ν/(ν − 2) is the variance of X?

As you’d expect, the limit of f(ν) as ν → ∞ is the probability of a six-sigma event for a normal distribution, around 10−7 as mentioned above. Here’s a plot of f(ν) for ν > 3. Notice that the vertical axis is on a log scale, i.e. the probability decreases exponentially.

What you might not expect is that f(ν) isn’t monotone. It rises to a maximum value before it decays exponentially. In hindsight this makes sense. As ν → 2+ the variance becomes infinite, and the probability of being infinitely far from the mean is 0. Here’s a plot of f(ν) between 2 and 3.

So six sigma probabilities for a Student t distribution rise from 0 up to a maximum of around 10−3 then decrease exponentially, then asymptotically approach a value around 10−7.

Related posts

The middle binomial coefficient

The previous post contained an interesting observation:

\sqrt{52!} \approx 26! \, 2^{26}

Is it true more generally that

\sqrt{(2n)!} \approx n! \, 2^n

for large n? Sorta, but the approximation gets better if we add a correction factor.

If we square both sides of the approximation and move the factorials to one side, the question becomes whether

\frac{(2n)!}{(n!)^2} = \binom{2n}{n} \approx 4^n

Now the task becomes to estimate the middle coefficient in when we apply the binomial theorem to (xy)2n.

A better approximation for the middle binomial coefficient is

\binom{2n}{n} \approx \frac{4^n}{\sqrt{\pi n}}

Now the right hand side is the first term of an asymptotic series for the left. The ratio of the two sides goes to 1 as n → ∞.

We could prove the asymptotic result using Stirling’s approximation, but it’s more fun to use a probability argument.

Let X be a binomial random variable with distribution B(2n, 1/2). As n grows, X converges in distribution to a normal random variable with the same mean and variance, i.e. with μ = n and σ² = n/2. This says for large n,

\text{Prob}(X = 1/2) = \binom{2n}{n} 4^{-n} \approx \frac{1}{\sqrt{2\pi\sigma^2}} = \frac{1}{\sqrt{\pi n}}

The argument above only gives the first term in the asymptotic series for the middle coefficient. If you want more terms in the series, you’ll need to use more terms in Stirling’s series. If we add a couple more terms we get

\binom{2n}{n} = \frac{4^n}{\sqrt{\pi n}} \left(1 - \frac{1}{8n} + \frac{1}{128n^2} + {\cal O}\left(\frac{1}{n^3}\right) \right)

Let’s see how much accuracy we get in estimating 52 choose 26.

from scipy.special import binom
from numpy import pi, sqrt

n = 26
exact = binom(2*n, n)
approx1 = 4**n/sqrt(pi*n)
approx2 = approx1*(1 - 1/(8*n))
approx3 = approx1*(1 - 1/(8*n) + 1/(128*n**2))

for a in [approx1, approx2, approx3]:
    print(exact/a)

This prints

0.9952041409266293
1.0000118903997048
1.0000002776131290

and so we see substantial improvement from each additional term. This isn’t always the case with asymptotic series. We’re guaranteed that for a fixed number of terms, the relative error goes to zero as n increases. For a fixed n, we do not necessarily get more accuracy by including more terms.

Related posts

Perfect and imperfect shuffles

Take a deck of cards and cut it in half, placing the top half of the deck in one hand and the bottom half in the other. Now bend the stack of cards in each hand and let cards alternately fall from each hand. This is called a rifle shuffle.

Random shuffles

Persi Diaconis proved that it takes seven shuffles to fully randomize a desk of 52 cards. He studied videos of people shuffling cards in order to construct a realistic model of the shuffling process.

Shuffling randomizes a deck of cards due to imperfections in the process. You may not cut the deck exactly in half, and you don’t exactly interleave the two halves of the deck. Maybe one card falls from your left hand, then two from your right, etc.

Diaconis modeled the process with a probability distribution on how many cards are likely to fall each time. And because his model was realistic, after seven shuffles a deck really is well randomized.

Perfect shuffles

Now suppose we take the imperfection out of shuffling. We do cut the deck of cards exactly in half each time, and we let exactly one card fall from each half each time. And to be specific, let’s say the first card will always fall from the top half of the deck. That is, we do an in-shuffle. (See the next post for a discussion of in-shuffles and out-shuffles.) A perfect shuffle does not randomize a deck because it’s a deterministic permutation.

To illustrate a perfect in-shuffle, suppose you start with a deck of these six cards.

A23456

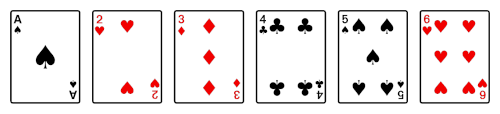
Then you divide the deck into two halves.

A23 456

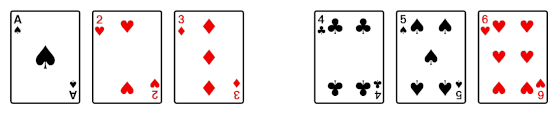
Then after the shuffle you have the following.

4A5263

Incidentally, I created the images above using a font that included glyphs for the Unicode characters for playing cards. More on that here. The font produced black-and-white images, so I edited the output in GIMP to turn things red that should be red.

Coming full circle

If you do enough perfect shuffles, the deck returns to its original order. This could be the basis for a magic trick, if the magician has the skill to repeatedly perform a perfect shuffle.

Performing k perfect in-shuffles will restore the order of a deck of n cards if

2k = 1 (mod n + 1).

So, for example, after 52 in-shuffles, a deck of 52 cards returns to its original order. We can see this from a quick calculation at the Python REPL:

>>> 2**52 % 53
1

With slightly more work we can show that less than 52 shuffles won’t do.

>>> for k in range(1, 53):
    ... if 2**k % 53 == 1: print(k)
52

The minimum number of shuffles is not always the same as the size of the deck. For example, it takes 4 shuffles to restore the order of a desk of 14 cards.

>>> 2**4 % 15
1

Shuffle code

Here’s a function to perform a perfect in-shuffle.

def shuffle(deck):
    n = len(deck)
    return [item for pair in zip(deck[n//2 :], deck[:n//2]) for item in pair]

With this you can confirm the results above. For example,

n = 14
k = 4
deck = list(range(n))
for _ in range(k):
    deck = shuffle(deck)
print(deck)

This prints 0, 1, 2, …, 13 as expected.

Related posts

Trying to fit exponential data

The first difficulty in trying to fit an exponential distribution to data is that the data may not follow an exponential distribution. Nothing grows exponentially forever. Eventually growth slows down. The simplest way growth can slow down is to follow a logistic curve, but fitting a logistic curve has its own problems, as detailed in the previous post.

Suppose you are convinced that whatever you’re wanting to model follows an exponential curve, at least over the time scale that you’re interested in. This is easier to fit than a logistic curve. If you take the logarithm of the data, you now have a linear regression problem. Linear regression is numerically well-behaved and has been thoroughly explored.

There is a catch, however. When you extrapolate a linear regression, your uncertainly region flares out as you go from observed data to linear predictions based on the observed data. Your uncertainty grows linearly. But remember that we’re not working with the data per se; we’re working with the logarithm of the data. So on the original scale, the uncertainty flares out exponentially.

Trying to fit a logistic curve

A logistic curve, sometimes called an S curve, looks different in different regions. Like the proverbial blind men feeling different parts of an elephant, people looking at different segments of the curve could come to very different impressions of the full picture.
logistic curve with extrapolations

It’s naive to look at the left end and assume the curve will grow exponentially forever, even if the data are statistically indistinguishable from exponential growth.

A slightly less naive approach is to look at the left end, assume logistic growth, and try to infer the parameters of the logistic curve. In the image above, you may be able to forecast the asymptotic value if you have data up to time t = 2, but it would be hopeless to do so with only data up to time t = −2. (This post was motivated by seeing someone trying to extrapolate a logistic curve from just its left tail.)

Suppose you know with absolute certainty that your data have the form

y(t) = \frac{a}{\exp(-b(t - c)) + 1} + \varepsilon

where ε is some small amount of measurement error. The world is not obligated follow a simple mathematical model, or any mathematical model for that matter, but for this post we will assume that for some inexplicable reason you know the future follows a logistic curve; the only question is what the parameters are.

Furthermore, we only care about fitting the a parameter. That is, we only want to predict the asymptotic value of the curve. This is easier than trying to fit the b or c parameters.

Simulation experiment

I generated 16 random t values between −5 and −2, plugged them into the logistic function with parameters a = 1, b = 1, and c = 0, then added Gaussian noise with standard deviation 0.05.

My intention was to do this 1000 times and report the range of fitted values for a. However, the software I was using (scipy.optimize.curve_fit) failed to converge. Instead it returned the following error message.

RuntimeError: Optimal parameters not found: Number of calls to function has reached maxfev = 800.

When you see a message like that, your first response is probably to tweak the code so that it converges. Sometimes that’s the right thing to do, but often such numerical difficulties are trying to tell you that you’re solving the wrong problem.

When I generated points between −5 and 0, the curve_fit algorithm still failed to converge.

When I generated points between −5 and 2, the fitting algorithm converged. The range of a values was from 0.8254 to 1.6965.

When I generated points between −5 and 3, the range of a values was from 0.9039 to 1.1815.

Increasing the number of generated points did not change whether the curve fitting method converge, though it did result in a smaller range of fitted parameter values when it did converge.

I said we’re only interested in fitting the a parameter. I looked at the ranges of the other parameters as well, and as expected, they had a wider range of values.

So in summary, fitting a logistic curve with data only on the left side of the curve, to the left of the inflection point in the middle, may completely fail or give you results with wide error estimates. And it’s better to have a few points spread out through the domain of the function than to have a large number of points only on one end.

Related posts

Rolling n-sided dice to get at least n

Dungeons and Dragons dice

Say you have a common 6-sided die and need to roll it until the sum of your rolls is at least 6. How many times would you need to roll?

If you had a 20-sided die and you need to roll for a sum of at least 20, would that take more rolls or fewer rolls on average?

According to [1], the expected number of rolls of an n-sided dice for the sum of the rolls to be n or more equals

\left(1 + \frac{1}{n}\right)^{n-1}

So for a 6-sided die, the expected number of rolls is (7/6)5 = 2.1614.

For a 20-sided die, the expected number of rolls is (21/20)19 = 2.5270.

The expected number of rolls is an increasing function of n, and it converges to e.

Here’s a little simulation script for the result above.

from numpy.random import randint

def game(n):
    s = 0
    i = 0
    while s < n:
        s += randint(1, n+1)
        i += 1
    return i

N = 1_000_000
s = 0
n = 20
for _ in range(N):
    s += game(n)
print(s / N)

This produced 2.5273.

[1] Enrique Treviño. Expected Number of Dice Rolls for the Sum to Reach n. American Mathematical Monthly, Vol 127, No. 3 (March 2020), p. 257.

Weighting an average to minimize variance

Suppose you have $100 to invest in two independent assets, A and B, and you want to minimize volatility. Suppose A is more volatile than B. Then putting all your money on A would be the worst thing to do, but putting all your money on B would not be the best thing to do.

The optimal allocation would be some mix of A and B, with more (but not all) going to B. We will formalize this problem and determine the optimal allocation, then generalize the problem to more assets.

Two variables

Let X and Y be two independent random variables with finite variance and assume at least one of X and Y is not constant. We want to find t that minimizes

\text{Var}[tX + (1-t)Y]

subject to the constraint 0 ≤ t ≤ 1. Because X and Y are independent,

\text{Var}[tX + (1-t)Y] = t^2 \text{Var}[X] + (1-t)^2 \text{Var}[Y]

Taking the derivative with respect to t and setting it to zero shows that

t = \frac{\text{Var}[Y]}{\text{Var}[X] + \text{Var}[Y]}

So the smaller the variance on Y, the less we allocate to X. If Y is constant, we allocate nothing to X and go all in on Y.  If X and Y have equal variance, we allocate an equal amount to each. If X has twice the variance of Y, we allocate 1/3 to X and 2/3 to Y.

Multiple variables

Now suppose we have n independent random variables Xi for i running from 1 to n, and at least one of the variables is not constant. Then we want to minimize

\text{Var}\left[ \sum_{i=1}^n t_i X_i \right] = \sum_{i=1}^n t_i^2 \text{Var}[X_i]

subject to the constraint

\sum_{i=1}^n t_i = 1

and all ti non-negative. We can solve this optimization problem with Lagrange multipliers and find that

t_i \text{Var}[X_i] = t_j \text{Var}[X_j]

for all 1 ≤ i, jn. These (n − 1) equations along with the constraint that all the ti sum to 1 give us a system of equations whose solution is

t_i = \frac{\prod_{j \ne i} \text{Var}[X_j]}{\sum_{i = 1}^n \prod_{j \ne i} \text{Var}[X_j]}

Incidentally, the denominator has a name: the (n − 1)st elementary symmetric polynomial in n variables. More on this in the next post.

Related posts

Generating random points in Colorado

The previous post looked at how to generate random points on a sphere, generating spherical coordinates directly. I wanted to include a demonstration that this generates points with the same distribution as the more customary way of generating points on a sphere, and then decided the demonstration should be its own post.

I’ll generate random points in Colorado using both methods and show that both put the same proportion of points in the state, within a margin that we’d expect from random points.

I thought about using Wyoming, because I’ve been there recently, or Kansas, because I’m going there soon. Although Wyoming and Kansas are essentially rectangles, there are minor complications to the coordinates of the corners. But Colorado is very simple: it’s bounded by latitudes 37°N and 41°N and by longitudes 102.05°W and 109.05°W.

Here are the two ways of generating points on a sphere.

from numpy import *

# Random point on unit sphere in spherical coordinates
def random_spherical():
    rho = 1
    theta = 2*pi*random.random()
    phi = arccos(1 - 2*random.random())
    return (rho, theta, phi)

# Random point on unit sphere in Cartesian coordinates
def random_cartesian():
    v = random.normal(size=3)
    return v / linalg.norm(v)

We’ll need to convert Cartesian coordinates to spherical coordinates.

def cartesian_to_spherical(v):
    rho = linalg.norm(v)
    theta = arctan2(v[1], v[0])
    phi = arccos(v[2] / rho)
    return (rho, theta, phi)

And we’ll need to convert spherical coordinates to latitude and longitude in degrees. Note that latitude is π/2 minus the polar angle.

def spherical_to_lat_long(rho, theta, phi):
    lat = rad2deg(pi/2 - phi)
    long = rad2deg(theta)
    return (lat, long)

And finally, we need a way to test whether a (lat, long) pair is in Colorado.

def in_colorado(lat, long):
    return (37 <= lat < 41) and (102.05 <= long <= 109.05)

Now we’ll generate a million random points each way and count how many land in Colorado.

random.seed(20251022)
N = 1_000_000

count = 0
for _ in range(N):
    rho, theta, phi = random_spherical()
    lat, long = spherical_to_lat_long(rho, theta, phi)
    if in_colorado(lat, long):
        count += 1
print(count / N)

count = 0
for _ in range(N):
    v = random_cartesian()
    rho, theta, phi = cartesian_to_spherical(v)
    lat, long = spherical_to_lat_long(rho, theta, phi)
    if in_colorado(lat, long):
        count += 1
print(count / N) 

This prints 0.000534 and 0.000536.

Efficiency

Note that this isn’t a very efficient way to generate points in Colorado since only about 5 out of every 10,000 points land in the state. If you wanted to generate points only in Colorado, you could randomly generate latitudes between 37° and 41°N and randomly generate longitudes 102.05° and 109.05°. This might be good enough in practice, depending on the application, but it’s not quite right because Colorado is not a Euclidean rectangle but a spherical rectangle.

A more accurate approach would be to randomly generate longitudes 102.05° and 109.05° as above, but generate latitudes as the arccos of points uniformly generated between cos(37°) and cos(41°).


Distribution of correlation

One of the more subtle ideas to convey in an introductory statistics class is that statistics have distributions.

Students implicitly think that when you calculate a statistic on a data set, say the mean, that then you have THE mean. But if your data are (modeled as) samples from a random variable, then anything you compute from those samples, such as the mean, is also a random variable. When you compute a useful statistic, it’s not as random as the data, i.e. it has smaller variance, but it’s still random.

A couple days ago I wrote about Fisher’s transform to make the distribution sample correlations closer to normal. This post will make that more concrete.

Preliminaries

We’ll need to bring in a few Python libraries. While we’re at it, let’s set the random number generator seed so the results will be reproducible.

import numpy as np
import matplotlib.pyplot as plt
from scipy.stats import skew

np.random.seed(20251020)

Correlated RNG

Next, we’ll need a way to generate correlated random samples, specifying the correlation ρ and the sample size N.

def gen_correlated_samples(rho, N):
    mean = [0, 0]
    cov = [
        [1, rho],
        [rho, 1]
    ]
    return np.random.multivariate_normal(mean, cov, size=N)

Calculating correlation

Once we generate correlated pairs, we need to calculate their correlation. To be more precise, their linear (Pearson) correlation. To do this we’ll find the empirical covariance matrix, the sample counterpart to the covariance matrix specified in the generator code above. The correlation coefficient is then the off-diagonal element of the covariance matrix.

def pearsonr(X):
    correlation_matrix = np.corrcoef(X[:,0], X[:,1])
    return correlation_matrix[0, 1]

Simulation

Now we’re ready to do our simulation.

M = 10000
rs = np.zeros(M)
for i in range(M):
    X = gen_correlated_samples(0.9, 100)
    rs[i] = pearsonr(X)

Notice that there are two levels of sampling. We’re generating random samples of size 100 and computing their correlation; that’s sampling our underlying data. And we’re repeating the process of computing the correlation 10,000 times; that’s sampling the correlation.

Untransformed distribution

Next we view the distribution of the correlation values.

plt.hist(rs, bins=int(np.sqrt(M)))
plt.show()
plt.close()

This gives the following plot.

It’s strongly skewed to the left, which we can quantify by calculating the skewness.

print(skew(rs))

This tells us the skewness is −0.616. A normal distribution has skewness 0. The negative sign tells us the direction of the skew.

Transformed distribution

Now let’s apply the Fisher transformation and see how it makes the distribution much closer to normal.

xformed = np.arctanh(rs)
plt.hist(xformed, bins=int(np.sqrt(M)))
plt.show()
plt.close()
print(skew(xformed))

This produces the plot below and prints a skewness value of −0.0415.

Small correlation example

We said before that when the correlation ρ is near zero, the Fisher transformation is less necessary. Here’s an example where ρ = 0.1. It’s not visibly different from a normal distribution, and the skewness is −0.1044.

Observation and conjecture

In our two examples, the skewness was approximately −ρ. Was that a coincidence, or does that hold more generally? We can test this with the following code.

def skewness(rho):
    rs = np.zeros(M)
    for i in range(M):
        X = gen_correlated_samples(rho, 100)
        rs[i] = pearsonr(X)
    return skew(rs)
    
rhos = np.linspace(-1, 1, 100)
ks = [skewness(rho) for rho in rhos]
plt.plot(rhos, ks)
plt.plot(rhos, -rhos, "--", color="gray")
plt.show()

Here’s the resulting plot.

It looks like the skewness is not exactly −ρ, but −cρ for some c < 1. Maybe c depends on the inner sample size, in our case 100. But it sure looks like skewness is at least approximately proportional to ρ. Maybe this is a well-known result, but I haven’t seen it before.