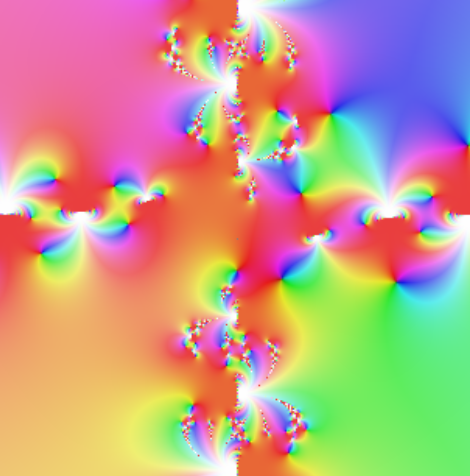
Define f(z) = iz*exp(-z/sin(iz)) + 1 and g(z) = f(f(z)) + 2 for a complex argument z. Here’s what the phase plots of g look like.
The first image lets the real and imaginary parts of z range from −10 to 10.
This close-up plots real parts between −1 and 0, and imaginary part between −3 and −2.
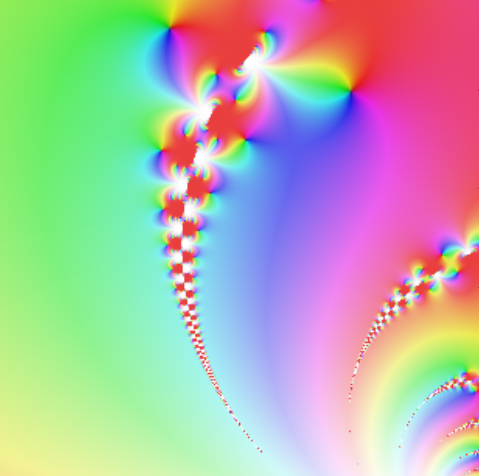
The plots were produced with this Python code:
from mpmath import cplot, sin, exp

def f(z): return 1j*z*exp(-z/sin(1j*z)) + 1

def g(z): return f(f(z)) + 2

cplot(g, [-1,0], [-3,-2], points=100000)
The function g came from Visual Complex Functions.
Read more: Applied complex analysis
I’ve been using mpmath for a while to generate Newton’s method fractals of various functions, e.g. this entry
I goofed a little on the title, it’s Newton’s method with
z = z – [exp(cos(z)) – cos(exp(z) -z]/[-sin(z)exp(cos(z)) + exp(z)sin(exp(z)) -1.0]
You might be interested in taking a look at
http://www.math.osu.edu/~fowler.291/phase/
which Steve Gubkin and I will be using to build an online complex analysis course, along the lines of our https://mooculus.osu.edu/