Colors of noise
In a previous post I explained the rationale behind using names of colors to refer to different kinds of noise. The basis is an analogy between the spectra of sounds and the spectra of light. Red noise is biased toward the low end of the audio spectrum just as red light is toward the low end of the visible spectrum. Blue noise is biased toward the high end, just as blue light is toward the high end of the visible spectrum.
Green noise
Green noise is based on a slightly different analogy with light as described here:
Blue, green and other noise colours seem not to be rigorously defined although the word “colour” is used a lot in describing noise. Some define the 7 rainbow colours to correspond to a width of about three critical bands in the Bark frequency scale such that green lies in the corresponding point of greatest sensitivity … [just as green light has] the greatest sensitivity for the eye. This identifies green noise as the most troublesome for speech systems.
This is different than the usual definition of red noise etc. in that it speaks of colors limited to a particular frequency range rather than being weighted toward that range. Usually red noise contains a broad spectrum of frequencies, but the weighted like 1/f2, so the spectrum decreases fairly quickly as frequency increases.
Barks
So what is this Bark frequency scale? First of all, the Bark scale was named in honor of acoustician Heinrich Barkhausen. On this scale, the audible spectrum runs from 0 to 24, each Bark being a sort of psychologically equal division. Lots of things in psychoacoustics work on the Bark scale rather than the scale of Hertz.
There are multiple ways to convert from Hz to Bark and back, each slightly different but approximately equivalent. A convenient form is
z = 6 arcsinh(f/600)
where f is frequency in Hertz and z is frequency in Bark. One reason this form is convenient is that it’s easy to invert:
f = 600 sinh(z/6)
A frequency of 24 Bark corresponds to around 16 kHz, so the audible spectrum doesn’t quite end at 24, at least for most young people, but applications are most concerned with the range of 0–24 Bark.
Update: Here’s an online calculator to convert between Hz and Bark.
The paragraph above is a little vague about where the color boundaries should be. When it says there are seven intervals, each “a width of about three critical bands,” I assume it means to divide the range of 0–24 Bark into seven equal pieces, making each 24/7 or 3.4 Barks wide. If we do this, red would run from 0–3.43 Barks, orange from 3.43–6.86, yellow from 6.86–12.29, green from 10.29–13.71, etc.
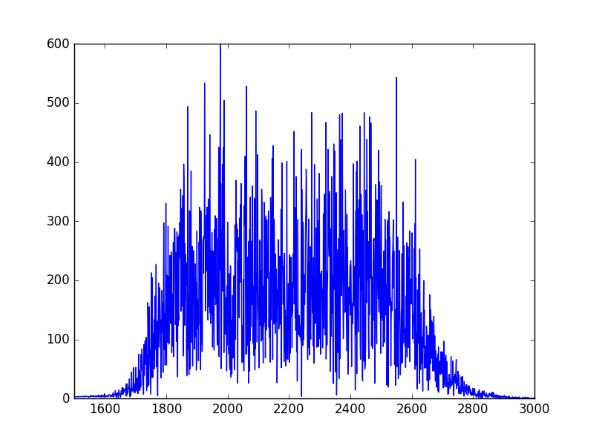
This would put green noise in the range of 1612 to 2919 Hz. Human hearing is most sensitive around 2000 Hz, near the middle of this interval.
In musical notation, the frequency range of green noise runs from G6 to F#7. See this post for an explanation of the pitch notation and Python code for computing it from frequency.
Update: See the next post for how to create an audio file of green noise in Python. Here’s a spectral plot from that post showing that the frequencies in the noise are in the expected range.
Need help with signal processing or acoustics?
I think the intent was to have the 7 bands be actually 3 Bark wide, which means that the first one starts at 0 Bark, and the last one *ends* at 24 Bark (7 * 3 + 3).
Andrew: If there are seven bands, starting at 0, each 3 Barks wide, then the last one ends at 21.
Band 1 ends in 3, band 2 ends in 6, etc. Band n ends in 3n. So band 7 would end in 21.
So, there are not a blues music but green music, the main frequency in the equalizer of guitar blues is around 1600 Hz… Very interesting!!!