My previous post gave three algorithms for converting color to grayscale. This post gives more examples and details.
The image below is a screenshot from an Excel spreadsheet illustrating color values and how the convert to grayscale. The R, G, and B columns are the red, green, and blue component values of the color sample in the leftmost column. The columns labeled “Li”, “Lu”, and “Avg” are the grayscale values of the color using the lightness, luminosity, and average algorithms from the previous post.
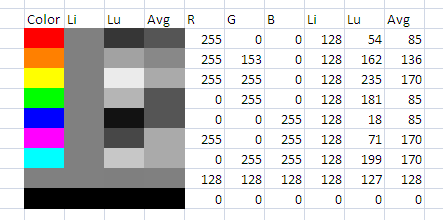
The grayscale color samples were created by asking Excel to set the background color to (X, X, X) where X is the grayscale value. For example, the background color for the “Lu” column of the first row is (54, 54, 54) since 54 is the luminosity value for pure red.
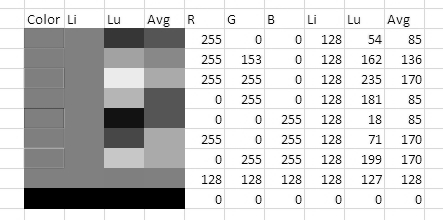
To verify the algorithms, I converted the screen shot above to a grayscale image using GIMP. The gray cells remain unchanged because all three algorithms leave gray alone; when all three RBG values are equal, it’s clear from the formulas that the grayscale value becomes the common value. The color cells in the first column become the shade of gray predicted and hence match the column of gray cells for that algorithm.
Using lightness:
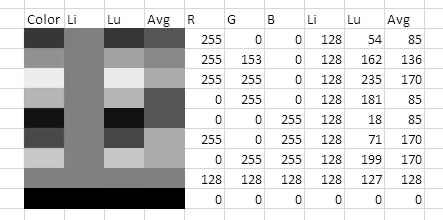
Using luminosity:
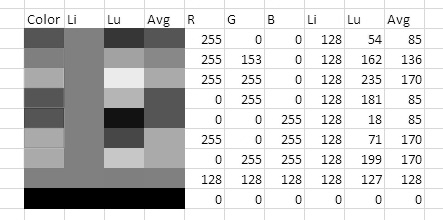
Using average:
Related post: Three algorithms for converting color to grayscale
It’s Great Post !!!
Thank you for sharing your knowledge Mr. John.
It’s clear for me now why my friends have different algorithm and formula to make an image become grayscale. I find those answer in here. ^_^
Thank you Mr. John.
Umm, and sorry for my lack of English.
I realize that this is an old post, but I’ve come across something strange with the luminosity coefficients that I don’t understand. I’ve been researching color words, trying to develop a casual color vocabulary for designers. One of the charts I’m developing shows all of the single-word color names from the xkcd Color Survey. I want it to reflect human perception, so I applied the Rec.709 coefficients to my data (Y = 0.2126 R + 0.7152 G + 0.0722 B), and while it was a marked improvement over the straight average formula for the majority of the spectrum, I noticed that the red sections of the chart did not appear to be ordered correctly. Desaturating the image in Preview confirmed my observation.
I can’t find an explanation for why the luminance values for reds would be inaccurate, or what other coefficients might be preferable. Any suggestions? The current version of my chart is the most recent post on my blog.
Thanks,
Joseph