Why would you want to plot a mathematical function using a drawing package like Inkscape rather than a mathematical package like Mathematica or R? One reason is that you may want plot for its visual properties. For example, you might want to include a sine wave in a drawing.
Another reason is that you may want to have more control (or at least easier control) over your plot. Mathematical packages make it easy to produce a basic plot with default options. But I’ve found it difficult to change the aesthetics of a plot in every mathematical package I’ve used. The things I want to do are often possible but require arcane options that I have trouble remembering. In a drawing program, it’s obvious how to manipulate a plot as an image.

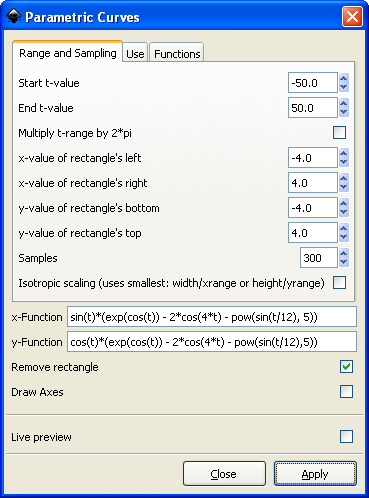
Inkscape provides a couple extensions to include function plots in a drawing. One is “Function Plotter” and the other is “Parametric Curves.” Both are found under Extensions -> Render. The following dialog shows the settings used to produce the graph above.
The first time I tried using these extensions nothing happened. Then I discovered you have to select a rectangle to contain the plot before creating a plot; the plotting tools do not create their own rectangles.
The Function Plotter supports rectangular and polar coordinates. You’re in for quite a surprise if you expect rectangular coordinates when the polar coordinates box is checked.
Do you know of an easy way of plotting data using Inkscape?
I don’t know of a way to plot data, but I wouldn’t be surprised if someone has written such an extension.
The function plotting extension is essentially a Python interpreter. There may be a way to have it call Python code that gives it your data.
Well,
I have been trying to find one, but the only thing I have found is rather cumbersome ways of doing it like described at http://trinifar.wordpress.com/2007/02/21/creating-graphs-with-inkscape/ (and in the comments)
Thanks anyway for pointing me to this useful tool.
/Tomas
For data plots I tend to produce a basic plot with gnumeric or similar, and export the plot as an svg file. Then I open that file with inkscape and edit it to make it visually pleasing.
Hi John
I’m trying to plot the graph above in inkscape. I’m following the image of the dialogue but I’m getting a syntax error. Any idea what could be happening (apart from a typo)?
Kevin: I just repeated the example in the screen shot and it worked for me. As I mentioned above, the first time I tried it I had a problem because I’d not selected a rectangle first, but that didn’t cause a syntax error.
Maybe you have a typo. Try copying and pasting the following:
sin(t)*(exp(cos(t)) - 2*cos(4*t) - pow(sin(t/12), 5))cos(t)*(exp(cos(t)) - 2*cos(4*t) - pow(sin(t/12), 5))beautiful! thanks!
My mistake was to assume that there were no spaces in the formula(?). is there a rule for putting spaces in so I can check before setting things in motion?
Very very beautiful butterfly.
I try to modify your function by start t-value = 0 and end t-value =6.28, but do not success.
Hi, I have used the function plotter, but I want to do some editing to the plots. I have made 3 phase sine curves (120 degrees phase shifted). I want to make part of the curves bold. Please suggest a method to do this.
Well, to make a part of the graph bold, just remember that you are ending up with a drawing.
To make one of the lines bold, select it, and go into ‘Stroke Style’, and set the line width, line type, color, and any other settings you would like to tweak.
Thanks, but I figured it out. I copied the plot, took the original to another layer and locked the layer. Then I made the copy bold, converted it to a path and took intersection with a rectangle to get the desired part bold, with the original graph in background on another layer. Thanks for the help though.
Your blog is very helpful, thank you!
Hi Thanks for mentioning that rectangle, was not able to figure out why nothing was appearing.
You have a very helpful blog :)
Thanks again
I know I’m digging up an old thread here, but is there a way to access other Python math operators in Inkscape? I want to plot a parametric curve involving a modular inverse. Thanks!
Remember: If you don’t have Python installed with Inkscape, none of this will work!
I try to plot a normal distribution with these functions:
t
exp(-pow(2,t))
(I also tried your beautiful butterfly above).
However in both cases I get an error message that ends with the following: “NameError: name ‘exp’ is not defined”
I have python installed on the laptop I’m using.
Any idea what might go wrong?
Cheers
This is an old post, so things have changed in Inskscape, but it sounds like you need to import exp, either from math or from numpy.
r (a) = a . e (a . cot(aT) ) would like to plot spiral given on left, as XY plot and then spin it round Z axis thru some angle OR ( 360 deg) create a 3D sapce objcet in Inkspace 1.3 .1 Is there a example for plotting exponential functions as shown above.
Also is there the provision to code so I could contro the output by slider to increase / decrease angles of rotations and translations etc
Thank you in anticipation – Illumine To Be Illuminated