A couple years ago I put up a web version of a chart of probability distribution relationships based on a chart by Lawrence Leemis. It lets you click on a distribution name or an arrow representing a relationship and get details. Here’s a thumbnail image of the diagram:
Ivan Yanikov had an idea for improving this, adding some JavaScript to the page so you can get additional information by hovering your mouse over the image rather than clicking. The advantage of this approach is that the page doesn’t scroll, so you don’t lose your place in the diagram. You can see his code here. If you’d like to play with it, save the distribution diagram page and paste Ivan’s code at the end just before the closing </html> tag.
Here’s a screen shot of what you’d see when you mouse over the geometric distribution.
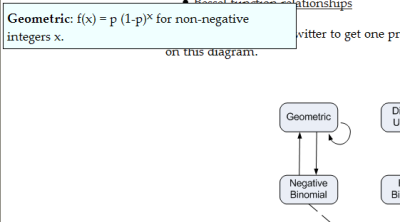
Ivan emphasized that this was a quick proof-of-concept rather than something he carefully polished. What would you do to improve it?
Related post: Six analysis and probability diagrams
From a intro to stats student, maybe add more relationships? e.g. continuous to discrete analogues, e.g. the Gamma to Negative Binomial. The relationship between Exponential and Poisson processes seems important, but I don’t know what you’d want to call that here.