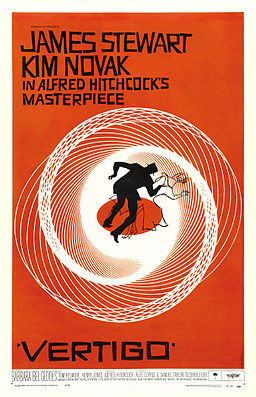
In his new book The Perfect Shape, Øyvind Hammer shows how to create a graph something like the poster for Alfred Hitchcock’s movie Vertigo.
Hammer’s code uses a statistical language called Past that I’d never heard of. Here’s my interpretation of his code using Python.
      import matplotlib.pyplot as plt
      from numpy import arange, sin, cos, exp

      i  = arange(5000)
      x1 = 1.0*cos(i/10.0)*exp(-i/2500.0)
      y1 = 1.4*sin(i/10.0)*exp(-i/2500.0)
      d  = 450.0
      vx = cos(i/d)*x1 - sin(i/d)*y1
      vy = sin(i/d)*x1 + cos(i/d)*y1

      plt.plot(vx, vy, "k")

      h = max(vy) - min(vy)
      w = max(vx) - min(vx)
      plt.axes().set_aspect(w/h)
      plt.show()
This code produces what’s called a harmonograph, related to the motion of a pendulum free to move in x and y directions:
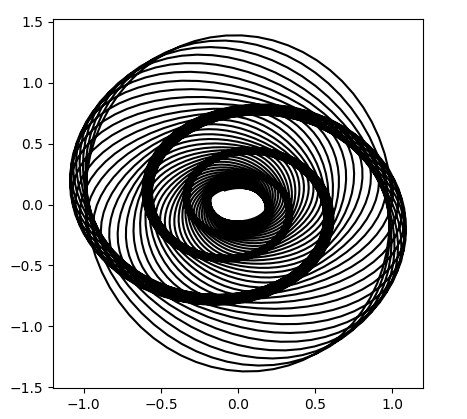
It’s not exactly the same as the movie poster, but it’s definitely similar. If you find a way to modify the code to make it closer to the poster, leave a comment below.
The pure harmonograph decays to a point, but in the original poster, the pendulum movement has converged to an ellipse. That means both the decay and the rotation have to stop – I implemented that over here https://hachyderm.io/@bbcmicrobot@mastodon.me.uk/110107562467030317 to draw the poster on the bbc model b. It’s not quite right: doing this caused the spiral to get a bit fatter – I think I just allowed the decay to change too early. But it’s pretty close.
Very nice!