This seems like a good time to discuss the difference between exponential growth and logistic growth as the covid19 pandemic is starting to look more like a logistic model and less like an exponential model, at least in many parts of the world [1]. This post is an expansion of a Twitter thread I wrote on AnalysisFact.
***
Nothing in the world grows exponentially forever.
The beginning of exponential growth is easier to understand that its end.
From the beginning there are factors that keep growth from being purely exponential, but they are negligible at first. They can be ignored for a while, but not forever.
A logistic model takes one limiting factor into account, but things could be much more complicated than that.
Even though logistic models are often more realistic than exponential models, I wouldn’t want someone to read this and say “Oh, I see. Epidemics (for example) aren’t exponential, they’re logistic.” A logistic model is still a simple idealization, more realistic than an exponential model, but still simplistic.
A system with exponential growth satisfies
![]()
That is, the rate of growth y‘ at any given time is proportional to the state y. If you have money invested at a fixed rate of interest, for example, the amount of interest you earn is proportional to how much you’ve invested.
A system with logistic growth satisfies
![]()
That is, the rate of growth is the proportional to the product of two things: the current state y and the complement of the current state 1 – y. For example, a simple epidemic model says the rate of spread is proportional to the product of the proportion of infected people and the proportion of uninfected people. The rate of infection slows down as there are fewer people who have not been exposed.
(Let me say one more time that this is a simplistic model. Please don’t read this then publish your own amateur analysis of a pandemic [2].)
Logistic growth applies to many things, not just epidemics. The spread of rumors, for example, is approximately logistic. The rate of spread depends on both the number of people spreading the rumor and the number of people who haven’t heard. Once most people have heard, the rate slows way down because people are sharing the rumor with others who have already heard.
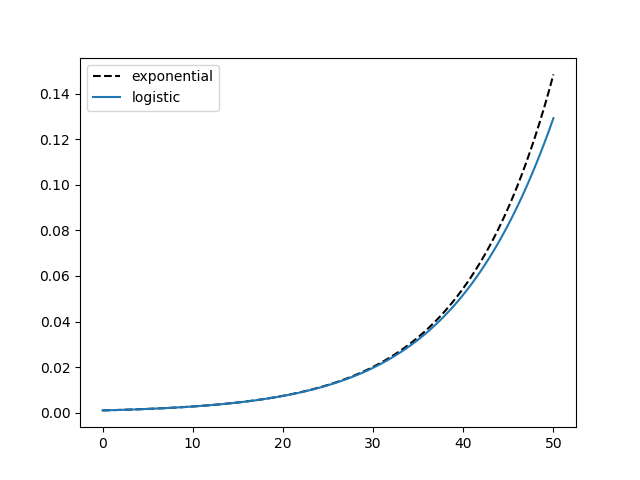
In the logistic differential equation above, when y is near 0, 1 − y is approximately 1 and so that term has little effect. That’s why logistic models look like exponential models at first. Here are plots of exponential and logistic models with y(0) = 0.001, k = 0.1, and time running from 0 to 50.
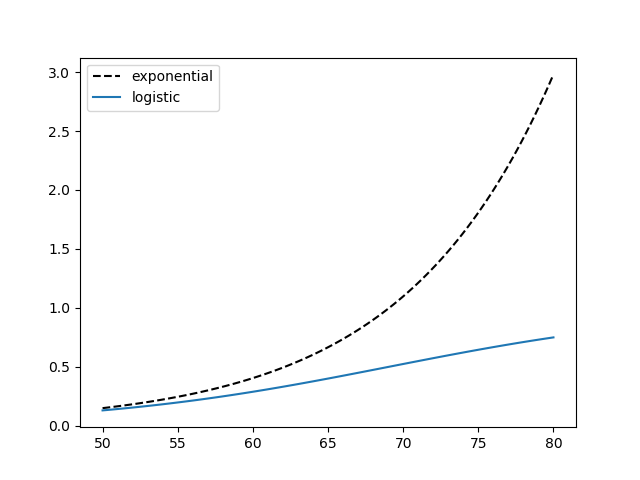
But the larger y gets, the more the 1 − y term matters more. Eventually it dominates. Here are the same functions for time running from 50 to 80.
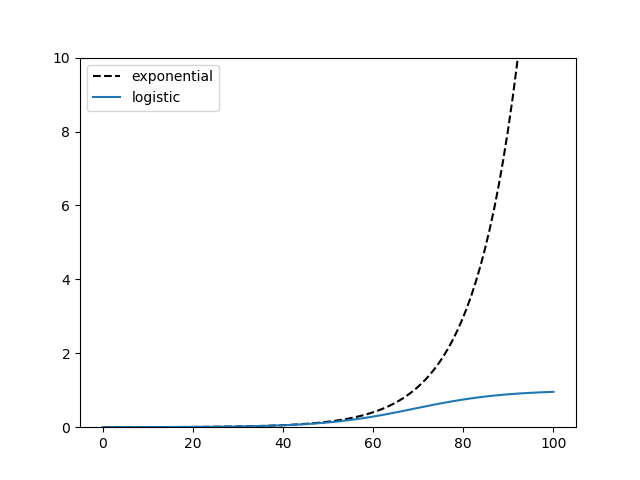
The logistic curve has a S shape and will flatten out, asymptotically approaching 1. Here’s a comparison of the two plots with time running from 0 to 100.
More logistic posts
- Fixed points of the logistic function
- Sensitivity of logistic regression
- Approximating a logistic regression integral
[1] I recently heard from a friend in Niger that the country only had its first case on March 18, long after much of the world. Unfortunately the disease is spreading rapidly, and I imagine growing approximately exponentially for now. To make matters worse, the Niger is at the bottom of the UN Heath Development Index as of 2018.
[2] Several people asked me from the beginning of the pandemic about mathematical models. I said that there would be many mathematical models, all over-simplified. I have not created or endorsed any model because I am not an epidemiologist. I have limited my comments to saying that epidemics are complex and there are a lot of unknowns.
Hi John,
Thanks for the comments on the mathematical modelling of the epidemic. The logistic model makes more sense to me as it captures the ‘flattening of the curve’ one would expect, which the exponential model does not capture.
Given your previous work with medical studies, any chance you would be willing to comment on the following in a blog post: 1) adopting an off-the-shelf anti-malaria drug as a treatment and what needs to be done to get a solid results out of the ongoing studies, and 2) how long will it take for a vaccine to be developed, tested, and approved for use.
Thanks. As for the anti-malarial drug (hydroxychloroquine) and vaccines, I would just be repeating things I’ve heard and don’t have any particular knowledge of.
I can share a quick anecdote from a doctor I know who has tested positive.
” I am taking Hydroxychloroquine and Azithromycin … hospital use indicated it works better if used early in the illness to lower the viral load … you have to discuss risks and benefits of the combo with your physician. Zinc appears to work together with those medicines …”
I’ve heard that it could be 12 to 18 months before a vaccine is mass produced. There are at least seven candidate vaccines, maybe more by now.
To quote a Nature Briefing from earlier today, “As of yesterday, there are 78 confirmed COVID-19 vaccine candidates, 5 of which have already entered clinical trials. ”
Someone needs to tell the economists to stop with their simplistic models of the epidemic as well. Even good, sensible economists are posting nonsense online.
https://www.bradford-delong.com/2020/04/raw-coronavirus-extrapolations.html
I know enough about epidemiology to know that I don’t know much about epidemiology.
I have been fighting battles trying to get folks to understand the multiple contexts of the COVID-19 numbers, and how comparing numbers with identical names from different areas or different times is fraught with problems.
The prime example is “Confirmed Cases”. This number tells far more about the testing process than the disease process. It is frustrating that the “Test Kits Processed” value isn’t also provided.
The other value, “Reported Deaths”, is likely more “real”, as nearly all deaths are tested no matter the overall test kit availability and distribution.
So, what can we learn from just those two numbers when they are reported together by a single entity, before they are combined with other results, either historical or geographical? It appears that the overall “actual” COVID-19 death rate is between 0.75 and 3 percent, with the most likely value being at or just above 1%. We can’t “trust” this number, but we can use it to help characterize data sets.
So, if we take that as our best general number, the ratio from a single data set can be used to give a crude estimate of how far testing has penetrated into the general population.
Three weeks ago, New York reported a single data set with about 700 Confirmed Cases and about 350 Reported Deaths. That’s a death rate of 50%! Or is it? What it does tell us is that during the period for those results, people were tested only when they had reached a 50% risk of dying. Given an “actual” death rate closer to 1%, that means only severely ill cases were being tested during that period.
The press and those presenting the data (including public officials) aren’t doing even such simple context analysis before rushing to show historical data and scary exponential graphs. (The data is plenty scary enough without such sensationalism.)
It’s a frustrating battle, but I’m committed to it. A side-effect is that two of my Facebooks posts went viral (a few thousand views, a first-ever for me) and I got to chat with two of our tiny local independent news agencies, one of which is highly data-driven, who were chagrined to have missed this simple observation.