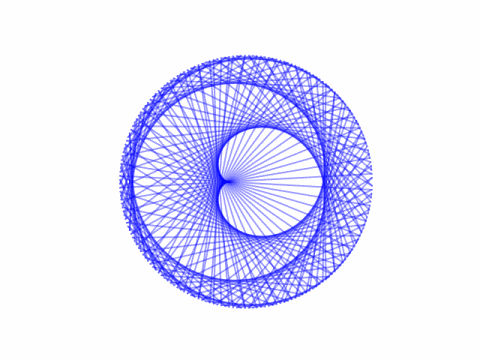
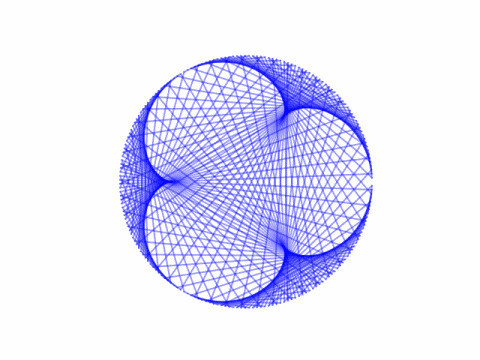
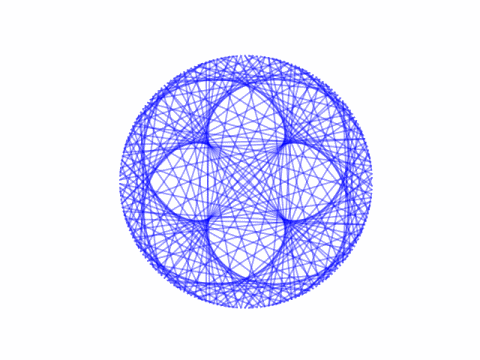
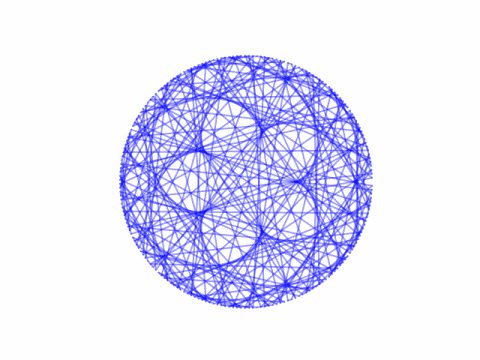
Imagine two ants crawling around a circle at different speeds and draw a line between the two ants at regular time intervals. The position of the two ants at time t are (cos pt, sin pt) and (cos qt, sin qt) where p and q are integers, p > q > 0, and t comes from dividing the interval [0, 2π] into an integer number of points.
These lines form an envelope, a set of tangent lines, around a curve in the middle known as an epicycloid.
I found this via [1]. An interesting tidbit from the paper is that the number of cusps in each epicycloid is
(p − q) / gcd(p, q).
Here are some examples.
The equation of the epicycloid framed by the tangent lines is

Here’s the code that produced the plots above.
from numpy import sin, cos, linspace, pi
import matplotlib.pyplot as plt

def draw(p, q, n=200):
    xs = linspace(0, 2*pi, n)
    plt.axes().set_aspect(1)
    plt.axis('off')
    for x in xs:
        plt.plot([cos(p*x), cos(q*x)],
                 [sin(p*x), sin(q*x)], "b-", alpha=0.4)
    plt.show()
    plt.close()

draw(4, 3)
draw(4, 1)
draw(7, 3)
draw(9, 4)
If we let q be negative, we get hypocycloids instead. That’s the topic of the next post.
Related: Harmonographs
[1] Andrew Simoson. An Envelope for a Spirograph. The College Mathematics Journal, Vol. 28, No. 2 (Mar., 1997), pp. 134-139
Those figures reminded me of this video from The Mathologer:
https://www.youtube.com/watch?v=qhbuKbxJsk8
Good work, John!