In [1] the authors look at applying Newton’s root-finding method to the function
f(z) = zp
where p = a + bi. They show that if you start Newton’s method at z = 1, the kth iterate will be
(1 − 1/p)k.
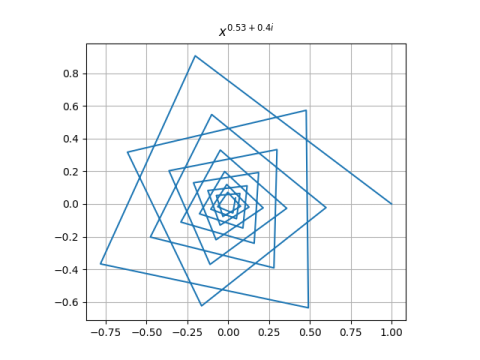
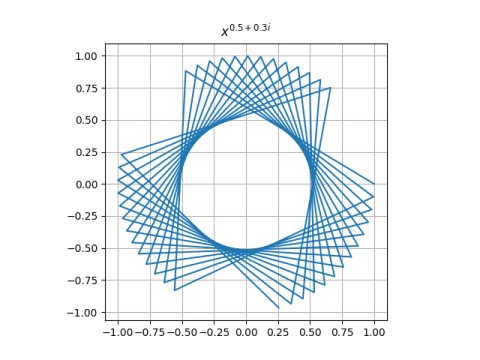
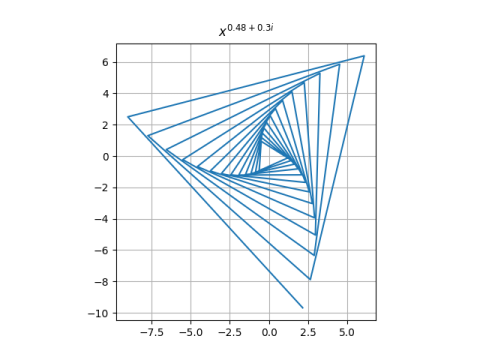
This converges to 0 when a > 1/2, runs around in circles when a = 1/2, and diverges to infinity when a < 1/2.
You can get a wide variety of images by plotting the iterates for various values of the exponent p. Here are three examples.
Here’s the Python code that produced the plots.
    import numpy as np
    import matplotlib.pyplot as plt

    def make_plot(p, num_pts=40):
        k = np.arange(num_pts)
        z = (1 - 1/p)**k
        plt.plot(z.real, z.imag)
        plt.axes().set_aspect(1)
        plt.grid()
        plt.title(f"$x^{{ {p.real} + {p.imag}i }}$")
        plt.savefig(f"newton_{p.real}_{p.imag}.png")
        plt.close()

    make_plot(0.53 + 0.4j)
    make_plot(0.50 + 0.3j)
    make_plot(0.48 + 0.3j)
Note that the code uses f-strings for the title and file name. There’s nothing out of the ordinary in the file name, but the title embeds LaTeX code, and LaTeX needs its own curly braces. The way to produce a literal curly brace in an f-string is to double it.
More posts on Newton’s method
[1] Joe Latulippe and Jennifer Switkes. Sometimes Newton’s Method Always Cycles. The College Mathematics Journal, Vol. 43, No. 5, pp. 365-370
Hi John, thanks for all your posts, which I’ve been enjoying for some months now. This is just a a tech comment about the code above. I get the graphs, but with a weird box in the centre (see http://www.cs.man.ac.uk/~toby/python/ )
However, if I call plt.axes().set_aspect(1) /before/ plt.plot(z.real, z.imag), instead of after it as in the original code, then the graphs come out ok.
I have python 3.8.3 (on macOS 10.15.7), numpy 1.20.2 and matplotlib 3.4.1.
best wishes!
Toby