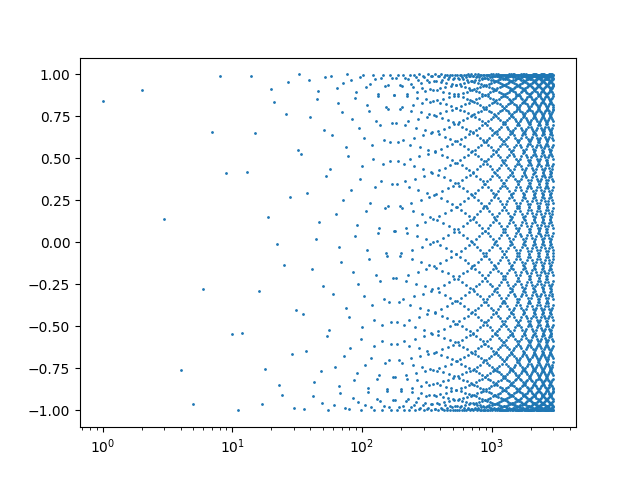
The following graph plots sin(1), sin(2), sin(3), etc. It is based on a graph I found on page 42 of Analysis by its History by Hairer and Wainer.
Here’s the Python code that produced the plot.
    import matplotlib.pyplot as plt
    from numpy import arange, sin

    x = arange(1, 3000)
    plt.scatter(x, sin(x), s=1)
    plt.xscale("log")
    plt.savefig("int_sin.png")
Update: See this post where we look at a couple variations on this exercise.
Very beautiful pattern, thanks for sharing.
I did a interactive panel, based on this:
https://asgunzi.github.io/Senos-inteiros/index.html
@Arnaldo: Nice page. It’s helpful to be able to interactively change the horizontal scale.