A few days ago I wrote a brief post showing an interesting pattern that comes from plotting sin(1), sin(2), sin(3), etc.
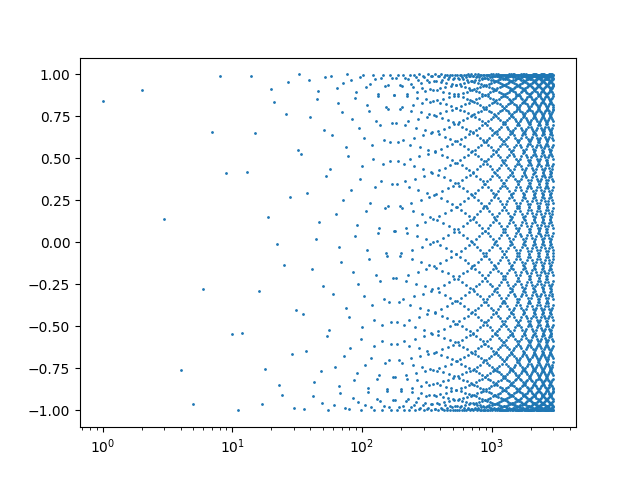
That post uses a logarithmic scale on the horizontal axis. You get a different, but also interesting, pattern when you use a linear scale.
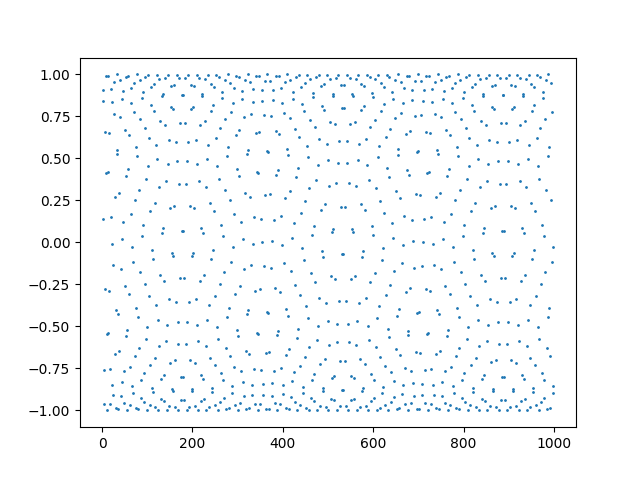
Someone commented that this looks like a projection of a carbon nanotube, and I think they’re right.
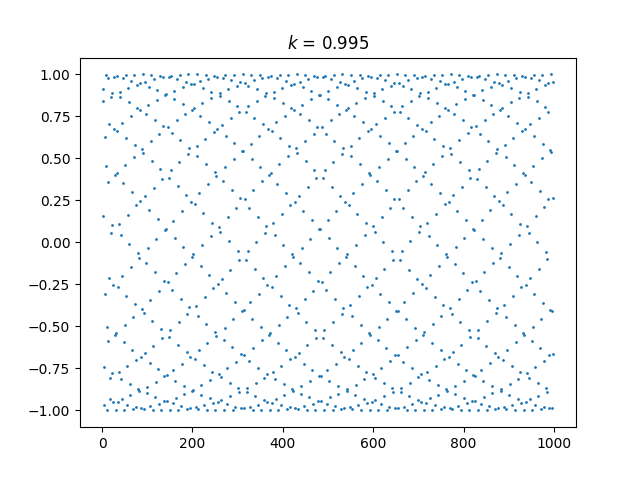
Let’s generalize this by plotting sin(kn) for integer n. The plot above corresponds to k = 1. Tiny changes to k make a big difference in the appearance of the plot.
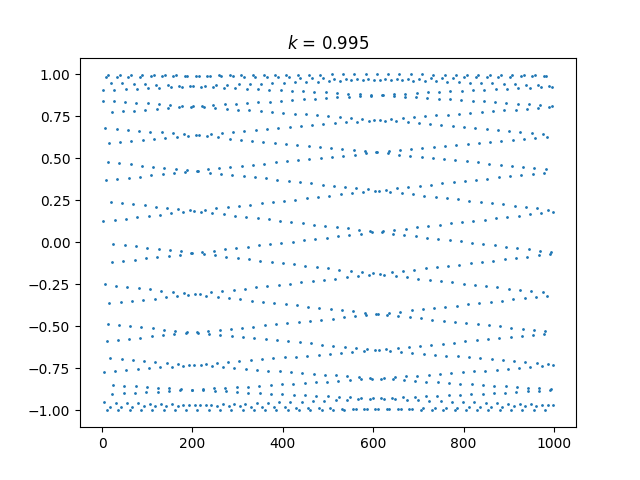
Here’s k = 0.995:
And here’s k = 1.005:
And here’s an animated plot, continuously changing k from 0.99 to 1.01.
This animation was created using the following Mathematica code.
    Animate[ListPlot[Table[Sin[k n], {n, 1, 1000}]], {k, 0.99, 1.01},
            AnimationRate -> 0.001, TrackedSymbols :> {k}]
Next thing you know, you’ll announce you’ve discovered a new kind of physics….. :-)
.ric
Where do the hexagons come from?!