A little while ago I wrote a post looking at how the infinite product for sine converges. The plot of the error terms is both mathematically and aesthetically interesting.
This post will look at similar plots for the reciprocal of the gamma function.
The reciprocal of the gamma function is an entire function, i.e. is analytic everywhere in the complex plane, and so it has an infinite product representation.
![]()
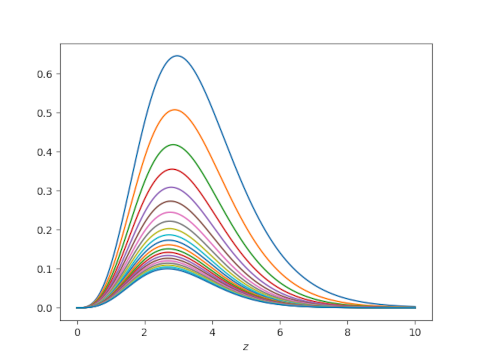
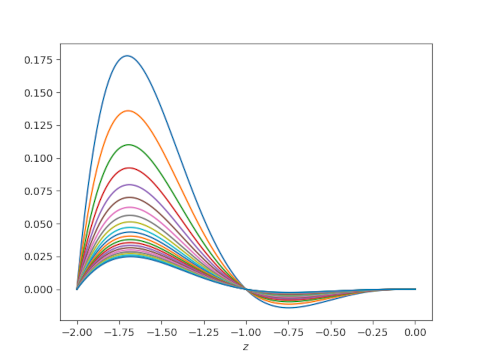
To visualize the convergence, we’ll take the product of the first N terms in the infinite product and subtract 1/Γ(z). We’ll plot these differences letting N range from 5 to 25.
Here’s the plot for -2 ≤ z ≤ 0.
And here’s the plot for 0 ≤ z ≤ 10.