Ever since Chris Anderson started writing about the long tail, there has been popular interest in “tails.” Popular writers like Chris Anderson don’t use statistical jargon, but what they call the “tail” is the tail of a statistical distribution. Some distributions have “thick” or “heavy” tails, meaning that they approach zero slowly in the extremes. Other distributions have “thin” or “light” tails, meaning the approach zero quickly.
This morning I ran across a new way of measuring how thick the tail of a distribution is. It’s called “index of tail weight.” If F(x) is the distribution (CDF) function of a random variable, the index of tail weight is defined as
![]()
where Φ is the distribution function of a standard normal. In words, this formula says to calculate the difference between the 99th percentile and the median and divide by the difference between the 75th percentile and the median for your distribution. Then divide by the same ratio for a normal distribution. This means that the index of tail weight will be 1 for a normal distribution. A little calculation shows that the definition is independent of location and scale for a location-scale family of distributions. So, for example, the index of tail weight will be 1 for any normal distribution, not just a standard normal.
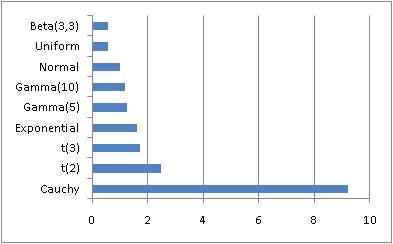
I’ve played around with this definition a little, and it seems to behave as I’d expect. The Cauchy distribution has a large index, 9.22588, and most distributions have smaller values.
For a gamma distribution, the index is independent of scale but depends on shape. A gamma with shape 1 (i.e. an exponential distribution) has weight 1.63635. As the shape increases, the index decreases, approaching 1 for large shape values. This makes sense because the gamma distribution becomes more like the normal as the shape parameter increases.
For the Student-t distribution, the index decreases to 1 as the degrees of freedom increase. This is what you’d expect since the t becomes approximately normal for large degrees of freedom.
The Weibull distribution has a larger index of tail weight than an exponential when the shape parameter is small, and the index decreases as the shape increases. For shape parameter 4, the Weibull has index 0.927819, which is reasonable since the tail then the tail falls off like exp(−x4) while the normal falls off like exp(-x2).
The book I found the definition in was Understanding Robust and Exploratory Data Analysis.