Suppose you want to create a background image that tiles well. You’d like it to be periodic horizontally and vertically so that there are no obvious jumps when the image repeats.
Functions like sine and cosine are period along the real line. But if you want to make a two-dimensional image by extending the sine function to the complex plane, the result is not periodic along the imaginary axis but exponential.
There are functions that are periodic horizontally and vertically. If you restrict your attention to functions that are analytic except at poles, these doubly-periodic functions are elliptic functions, a class of functions with remarkable properties. See this post if you’re interested in the details. Here we’re just after pretty wallpaper. I’ll give Python code for creating the wallpaper.
Here I’ll take a particular elliptic function sn(x). This is one of the Jacobi elliptic functions, somewhat analogous to the sine function, and use its phase portrait. Phase portraits use hue to encode the phase of a complex number, the θ value when a complex number is written in polar coordinates. The brightness of the color indicates the magnitude, the r value in polar coordinates.
Here’s the plot of sn(z, 0.2). (The sn function takes a parameter m that I arbitrarily chose as 0.2.) The plot shows two periods, horizontally and vertically. I included two periods so you could more easily see how it repeats. If you wanted to use this image as wallpaper, you could use 1/4 of the image, one period in each direction, to get by with a smaller image.
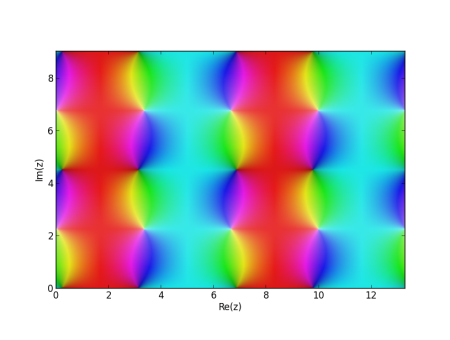
Here’s the Python code that was used to create the image.
    from mpmath import cplot, ellipfun, ellipk
    sn = ellipfun('sn')
    m = 0.2
    x = 4*ellipk(m) # horizontal period
    y = 2*ellipk(1-m) # vertical period
    cplot(lambda z: sn(z, m) - 0.2, [0, 2*x], [0, 2*y], points = 100000)
I subtracted 0.2 from sn just to shift the color a little. Adding a positive number shifts the color toward red. Subtracting a positive number shifts the color toward blue. You could also multiply by some constant to increase or decrease the brightness.
You could also play around with other elliptic functions, described in the mpmath documentation here. And you can find more on cplot here. For example, you could supply your own function for how phase is mapped to color. The saturated colors used by default are good for mathematical visualization, but more subtle colors could be better for aesthetics.
If you make some interesting images, leave a comment with a link to your image and a description of how you made it.
Read more: Applied complex analysis
If you google “rainbow color map”, you will see several articles / papers about how bad the rainbow color map is for visualization. There’s an MRI scan with several different color maps applied in one of the posts (http://medvis.org/2012/08/21/rainbow-colormaps-what-are-they-good-for-absolutely-nothing/ ) that I think gets the point across pretty well.
On the bright side, you are using saturated colors (as you mentioned), so that does avoid some of the problems with the map, but there still isn’t any visually intuitive ordering between the colors.
I thought John just wanted to make pretty wallpaper!?
Thanks John! You inspired me to use phase portraits to visualize adding terms in the Weierstrass function.
Blog post: http://blog.learnfromdata.com/2013/03/weierstrass-elliptic-function.html
YouTube: http://www.youtube.com/watch?v=WnaUZrPnZ30
I’m not sure, but it seems plausible to me that while Ben’s point about rainbow color maps is usually a good one, it may be less valid as a criticism of this way of visualizing complex functions.
As far as “how you made it”–the blog post links to code, but for now I’ll just say: “using an O(n^2) algorithm when O(n) is possible”.