A graph doesn’t have any geometric structure unless we add it. The vertices don’t come with any position in space. The same graph can look very different when arranged different ways.
Spectral coordinates are a natural way to draw a graph because they are determined by the properties of the graph, not arbitrary aesthetic choices. Construct the Laplacian matrix and let x and y be the eigenvectors associated with the second and third eigenvalues. (The smallest eigenvalue is always zero and has an eigenvector of all 1’s. The second and third eigenvalues and eigenvectors are the first to contain information about a graph.) The spectral coordinates of the ith node are the ith components of x and y.
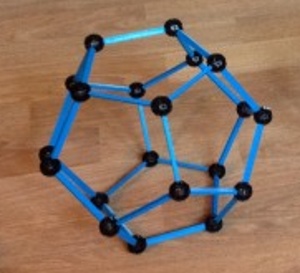
We illustrate this with a graph constructed from a dodecahedron, a regular solid with twenty vertices and twelve pentagonal faces. You can make a dodecahedron from a soccer ball by connecting the centers of all the white hexagons. Here’s one I made from Zometool pieces for a previous post:
Although we’re thinking of this graph as sitting in three dimensions, the nodes being the corners of pentagons etc., the graph simply says which vertices are connected to each other. But from this information, we can construct the graph Laplacian and use it to assign plane coordinates to each point. And fortunately, this produces a nice picture:

Here’s how that image was created using Python’s NetworkX library.
    import networkx as nx
    import matplotlib.pyplot as plt
    from scipy.linalg import eigh

    # Read in graph and compute the Laplacian L ...

    # Laplacian matrices are real and symmetric, so we can use eigh,
    # the variation on eig specialized for Hermetian matrices.
    w, v = eigh(L) # w = eigenvalues, v = eigenvectors

    x = v[:,1]
    y = v[:,2]
    spectral_coordinates = {i : (x[i], y[i]) for i in range(n)}
    G = nx.Graph()
    G.add_edges_from(graph)

    nx.draw(G, pos=spectral_coordinates)
    plt.show()
Update: After posting this I discovered that NetworkX has a method draw_spectral that will compute the spectral coordinates for you.
Thanks for all your posts on this. Two questions:
1) Are there specialized eigenvalue solvers for graph Laplacians? Or is the fact that it’s real and symmetric the best that you can do?
2) Is there any relation between the graph distance between two vertices, and the distance (Euclidean or otherwise) between their corresponding spectral coordinates? E.g. are the spectral coordinates an optimal (in some sense) choice to minimize the difference between the graph distance and the corresponding coordinate distance?
Chris, to answer your questions:
1) Not only is the matrix real and symmetric, more importantly it’s usually sparse. There are many algorithms for finding eigenvectors of sparse, symmetric matrices, such as the Lanczos method.
2) A pure graph has no distances between vertices. They’re either connected or not. If you have geometric information you want to preserve, then that’s outside of graph theory per se. Now you’re looking at dimension reduction and there are many algorithms for that too. The question of which algorithm is best depends on your criteria.
I’m really enjoying these posts on graph Laplacians. Thanks.
Sorry, that was a dumb question; I’m so used to dealing with weighted graphs that I forgot that these graphs didn’t have edge weights.
This can of course be done in 3D (or higher) as well, by taking the eigenvectors for the first 3 non-zero eigenvalues.
For the dodecahedron, this would result – after appropriate normalisation – in the vertices of a regular dodecahedron.
Spectral graph drawing can be interpreted as minimising the distances between vertices that are connected by an edge, subject to constraints (which prevent having all vertices at the origin, for example).
The optimisation tries to put each vertex at the “center” of its neighbours, again subject to constraints.