Suppose you have a graph of a function, but you don’t have an equation for it or the data that produced it. How can you reconstruction the function?
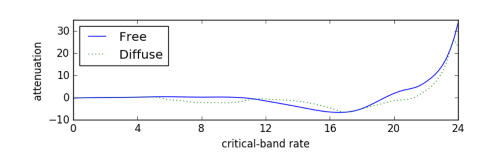
There are a lot of software packages to digitize images. For example, Web Plot Digitizer is one you can use online. Once you have digitized the graph at a few points, you can fit a spline to the points to approximately reconstruct the function. Then as a sanity check, plot your reconstruction to see if it looks like the original. It helps to have the same aspect ratio so you’re not distracted by something that doesn’t matter, and so that differences that do matter are easier to see.
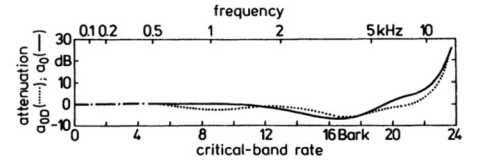
For example, here is a graph from Zwicker and Fastl’s book on psychoacoustics. It contains many graphs with no data or formulas. This particular one gives the logarithmic transmission factor between free field and the peripheral hearing system.
Here’s Python code to reconstruct the functions behind these two curves.
import matplotlib.pyplot as plt
import numpy as np
from scipy import interpolate

curve_names = ["Free", "Diffuse"]
plot_styles = { "Free" : 'b-', "Diffuse" : 'g:'}

data = {}
for name in curve_names:
    data = np.loadtxt("{}.csv".format(name), delimiter=',')

    x = data[:,0]
    y = data[:,1]
    spline = interpolate.splrep(x, y)
    xnew = np.linspace(0, max(x), 100)
    ynew = interpolate.splev(xnew, spline, der=0)
    plt.plot(xnew, ynew, plot_styles[name])

logical_x_range  = 24    # Bark
logical_y_range  = 40    # dB
physical_x_range = 7     # inch
physical_y_range = 1.625 # inch

plt.legend(curve_names, loc=2)
plt.xlabel("critical-band rate")
plt.ylabel("attenuation")
plt.xlim((0, logical_x_range))


plt.axes().set_aspect(
    (physical_y_range/logical_y_range) /
    (physical_x_range/logical_x_range) )
ax = plt.gca()
ax.get_xaxis().set_ticks([0, 4, 8, 12, 16, 20, 24])
ax.get_yaxis().set_ticks([-10, 0, 10, 20, 30])

plt.show()
Here’s the reconstructed graph.
Hi,
I try to run but it generates an error in line:
>>>np.loadtxt(“{}.csv”.format(name), delimiter=’,’)
No such file or directory: ‘Free.csv’
Could you suggest anything?
Thanks
It’s a reference to a data file I didn’t post online. You could digitize your own graph and use its data.
I see.
Could you add your data file to try it?
Because I dont know how I can do to obtain a cvs file from a digitized graph.
Thanks, John! That’s a useful tool.
Engauge is what I used and recommend to everyone. Easy to use, yet has advanced features. It can also save post-processed figures for later changes or audit. WebPlotDigitizer has only Windows offline version and does not have continuous integration setup.
http://markummitchell.github.io/engauge-digitizer/
Hi John,
I have a question did you download the graph as a .png file then converted it to .csv?
If I remember correctly, I uploaded an image to the web site mentioned in the post and it produced a csv.
Thank you – I like the way you set up your plot parameters as well. There are many ways to “skin a cat” –or “skin a potato” if you want to use PETA phrases ;) — but this is a nice example of hard-coding the axis limits and ticks.
Also a note – the web plot digitizer has moved to https://apps.automeris.io/wpd/
Thanks. I updated the link.
I prefer PlotDigitizer (https://plotdigitizer.com/) over WebPlotDigitizer. It is better and more stable than the latter.