John Tukey coined many terms that have passed into common use, such as bit (a shortening of binary digit) and software. Other terms he coined are well known within their niche: boxplot, ANOVA, rootogram, etc. Some of his terms, such as jackknife and vacuum cleaner, were not new words per se but common words he gave a technical meaning to.
Cepstrum is an anagram of spectrum. It involves an unusual use of power spectra, and is roughly analogous to making anagrams of a word. A related term, one we will get to shortly, is quefrency, an anagram of frequency. Some people pronounce the ‘c’ in cepstrum hard (like ‘k’) and some pronounce it soft (like ‘s’).
Let’s go back to an example from my post on guitar distortion. Here’s a note played with a fairly large amount of distortion:
And here is its power spectrum:
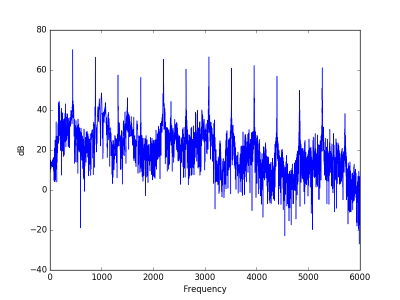
There’s a lot going on in the spectrum, but the peaks are very regularly spaced. As I mentioned in the post on the sound of a leaf blower, this is the fingerprint of a sound with a definite pitch. Spikes in the spectrum alone don’t indicate a definite pitch if they are irregularly spaced.
The peaks are fairly periodic. How to you find periodic patterns in a signal? Fourier transform! But if you simply take the Fourier transform of a Fourier transform, you essentially get the original signal back. The key to the cepstrum is to do something else between the two Fourier transforms.
The cepstrum starts by taking the Fourier transform, then the magnitude, then the logarithm, and then the inverse Fourier transform.
When we take the magnitude, we throw away phase information, which we don’t need in this context. Taking the log of the magnitude is essentially what you do when you compute sound pressure level. Some define the cepstrum using the magnitude of the Fourier transform and some the magnitude squared. Squaring only introduces a multiple of 2 once we take logs, so it doesn’t effect the location of peaks, only their amplitude.
Taking the logarithm compresses the peaks, bringing them all into roughly the same range, making the sequence of peaks roughly periodic.
When we take the inverse Fourier transform, we now have something like a frequency, but inverted. This is what Tukey called quefrency.
Looking at the guitar power spectrum above, we see a sequence of peaks spaced 440 Hz apart. When we take the inverse Fourier transform of this, we’re looking at a sort of frequency of a frequency, what Tukey calls quefrency. The quefrency scale is inverted: sounds with a high frequency fundamental have overtones that are far apart on the frequency domain, so the sequence of the overtone peaks has low frequency.
Here’s the plot of the cepstrum for the guitar sample.
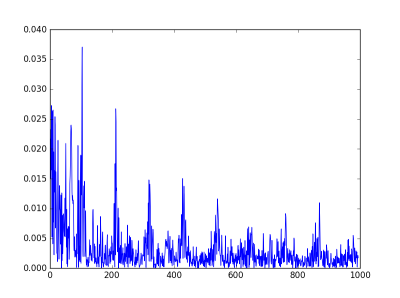
There’s a big peak at 109 on the quefrency scale. The audio clip was recorded at 48000 samples per second, so the 109 on the quefrency scale corresponds to a frequency of 48000/109 = 440 Hz. The second peak is at quefrency 215, which corresponds to 48000/215 = 223 Hz. The second peak corresponds to the perceived pitch of the note, A3, and the first peak corresponds to its first harmonic, A4. (Remember the quefrency scale is inverted relative to the frequency scale.)
I cheated a little bit in the plot above. The very highest peaks are at 0. They are so large that they make it hard to see the peaks we’re most interested in. These low quefrency peaks correspond to very high frequency noise, near the edge of the audible spectrum or beyond.
I’ve found it useful to keep in mind that convolution in the time domain is multiplication in the frequency domain. The log operation turns this into an addition, so if the original signal has a well defined excitation vs. spectral envelope, like speech or many musical instruments, those separate out cleanly in the cepstrum.
Does it make any sense to replace log magnitude with phons to get something like a perceptual cepstrum? That shouldn’t be capable of having crazy ultrasonic frequency components, at least.
Andrew, a classic approach is to replace the normal *frequency* with Mel-frequency, a perceptual frequency measure. That leads to the Mel -Frequency Cepstrum, commonly used as a feature vector in machine listening and musical information retrieval in the hope of it approximating the human auditory system a little better than the FFT. I have not seen this done with a perceptual amplitude measure, though.
John: couldn’t you take the autocorrelation of the magnitude spectrum? I posit that would tell you if the signal was tonal (by the size of the largest peak) and the frequency (by the position of the largest peak). Or is there already a name for that?
The reason the 0 Hz peak is enormous has a mathematical reason. It is not due to noise. You can get rid of it by subtracting the average log value of the log spectrum before doing the IFT.
“so the 109 on the quefrency scale corresponds to a frequency of 48000/109 = 440 Hz” I don’t catch the so, could someone explain?
Thx
@tcp/ip After a long time of thinking about it, this is what I understand:
The quefrency is a frequency of frequencies; this means that the value of each peak in the quefrency graph represents the period of a particular frequency in the power spectrum. Let this frequency be x. If the quefrency for x is 109, then it means peaks with interval ‘x’ has occurred 109 times in the power spectrum. If we imagine the power spectrum graph with peaks at a regular interval x, then there are 109 such peaks. This is similar to decomposing a complex signal into individual sine components with their own frequencies – here, the different sine components are ‘peaks’ that each occur at different periods.
The domain of frequencies is 0 to 48000, so to find the interval x, we divide 48000 / 109 to get 440.36. This means that there is a pattern of peaks that occur with period 440, which corresponds to A being an overtone (or fundamental, if a peak for a lower frequency doesn’t exist).
Hope you understood this explanation, and that it’s right.
not really. The 109 relates to the distance between the peaks, not their number of occurrence.
It’s a bit like what the human ear can do. You are perfectly capable of hearing the ground tone in a sound that consists purely of the higher harmonics without that ground tone being present.