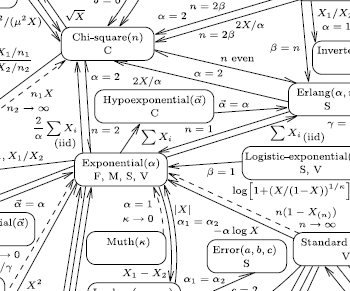
Lawrence Leemis published a chart in 1986 showing the relationships between around 20 probability distributions. I made an online version of this chart a few years ago.
In 2008 Leemis published a larger version of his original chart. A few days ago Leemis and his colleagues published an online version of the extended chart.
Related post: Six analysis and probability diagrams