Cover time
The cover time of a graph is the expected time it takes a simple random walk on the graph to visit every node. A simple random walk starts at some node, then at each step chooses with equal probability one of the adjacent nodes. The cover time is defined to be the maximum over all starting points of expected time to visit all nodes.
It seems plausible that adding edges to a graph would decrease its cover time. Sometimes this is the case and sometimes it isn’t, as we’ll demonstrate below.
Chains, complete graphs, and lollipops
This post will look at three kinds of graphs
- a chain of n vertices
- a complete graph on n vertices
- a “lollipop” with n vertices
A chain simply connects vertices in a straight line. A complete graph connects every node to every other node.
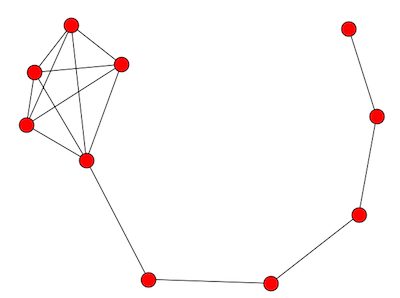
A lollipop with n vertices takes a chain with n/2 vertices and complete graph on n/2 vertices and joins them together. The image above is a lollipop graph of order 10. The complete graph becomes a clique in the new graph.
The image looks more like a kite than a lollipop because that’s the way my software (networkx) drew it by default. If you’d like, image the complete graph more round and the chain more straight so that the graph more closely resembles a lollipop.
Random walks on graphs
Chains have a long cover time. Complete graphs have a short cover time. What about lollipops?
A plausible answer would be that a lollipop graph would have a moderate cover time, somewhere between that of a complete graph and a chain. But that’s not the case. In fact, the lollipop has a longer cover time than either the complete graph or the chain.
You could think of a lollipop graph with n vertices as a chain of length n with extra edges added. This shows that adding edges does not always decrease the cover time.
The cover times for the three graphs we consider here are of different orders: O(n log n) for the complete graph, O(n2) for the chain, and O(n3) for the lollipop.
Now these are only asymptotic results. Big-O notation leaves out proportionality constants. We know that for sufficiently large n the cover times are ordered so that the complete graph is the smallest, then the chain, then the lollipop. But does n have to be astronomically large before this happens? What happens with a modest size n?
There’s a theoretical result that says the cover time is bounded by 2m(n − 1) where m is the number of edges and n the number of vertices. This tells us that when we say the cover time for the chain is O(n2) we can say more, that it’s less than 2n2, so at least in this case the proportionality constant isn’t large.
We’ll look at the cover times with some simulation results below based on n = 10 and n = 30 based on 10,000 runs.
With 10 nodes each, the cover times for the complete graph, chain, and lollipop were 23.30, 82.25, and 131.08 respectively.
With 30 nodes the corresponding cover times were 114.37, 845.16, and 3480.95.
So the run times were ordered as the asymptotic theory would suggest.
Interesting post.
We just posted a preprint about random walks on graphs using long-range (super-fast) random walks. We consider lollipops, random and complex networks.
See, https://arxiv.org/abs/1612.08631