Someone mailed me this afternoon asking if I knew what function was graphed on the cover of Abramowitz and Stegun’s famous Handbook of Mathematical Functions.
Here’s a close-up of the graph from a photo of my copy of A&S.
This was my reply.
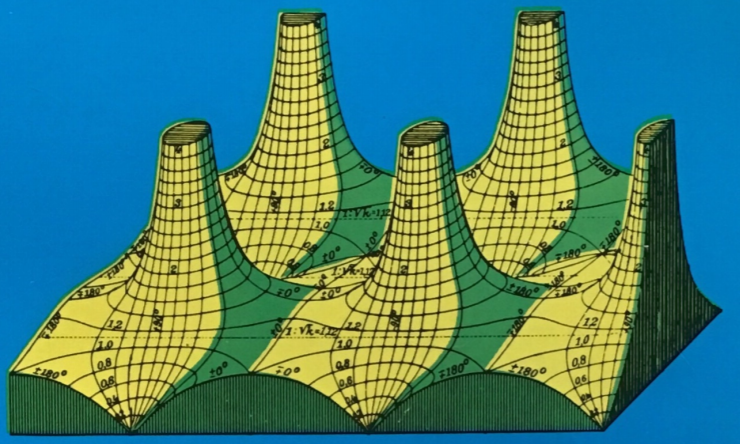
It looks like a complex function of a complex variable. I assume the height is the magnitude and the markings on the graph are the phase. That would make it an elliptic function because it’s periodic in two directions.
It has one pole and one zero in each period. I think elliptic functions are determined, up to a constant, by their periods, zeros, and poles, so it should be possible to identify the function.
In fact, I expect it’s the Weierstrass p function. More properly, the Weierstrass ℘ function, sometimes called Weierstrass’ elliptic function. (Some readers will have a font installed that will properly render ℘ and some not. More on the symbol ℘ here.)
Update: I was wrong about identifying the function, but a reader found the exact function that is being plotted.
It is an elliptic function, as you noted … It’s actually the Jacobi elliptic sn function for k=0.8 (so that the ratio 1:√k is approximately 1.12, as written near the middle of the diagram). The image comes from the famous “Tables of Functions with Formulas and Curves” by Jahnke and Emde (probably the only book with hand-drawn complex graphs of this quality), and you can see a lower quality version of the same image on the Archive here. … As an aside, you wrote “It has one pole and one zero in each period,” but there are actually two poles per period; you have to look carefully at the phase angles on the diagram to see that.
I’m a little surprised that it doesn’t state somewhere what function it is.
I’d be willing to bet that the figure appears somewhere in the book, so one could know. But … I don’t think I’m going to be the one to page through my copy. :-)