Introduction
Samples from a Cauchy distribution nearly follow Benford’s law. I’ll demonstrate this below. The more data you see, the more confident you should be of this. But with a typical statistical approach, crudely applied NHST (null hypothesis significance testing), the more data you see, the less convinced you are.
This post assumes you’ve read the previous post that explains what Benford’s law is and looks at how well samples from a Weibull distribution follow that law.
This post has two purposes. First, we show that samples from a Cauchy distribution approximately follow Benford’s law. Second, we look at problems with testing goodness of fit with NHST.
Cauchy data
We can reuse the code from the previous post to test Cauchy samples, with one modification. Cauchy samples can be negative, so we have to modify our leading_digit function to take an absolute value.
      def leading_digit(x):
          y = log10(abs(x)) % 1
          return int(floor(10**y))
We’ll also need to import cauchy from scipy.stats and change where we draw samples to use this distribution.
samples = cauchy.rvs(0, 1, N)
Here’s how a sample of 1000 Cauchy values compared to the prediction of Benford’s law:
|---------------+----------+-----------|
| Leading digit | Observed | Predicted |
|---------------+----------+-----------|
|             1 |      313 |       301 |
|             2 |      163 |       176 |
|             3 |      119 |       125 |
|             4 |       90 |        97 |
|             5 |       69 |        79 |
|             6 |       74 |        67 |
|             7 |       63 |        58 |
|             8 |       52 |        51 |
|             9 |       57 |        46 |
|---------------+----------+-----------|
Here’s a bar graph of the same data.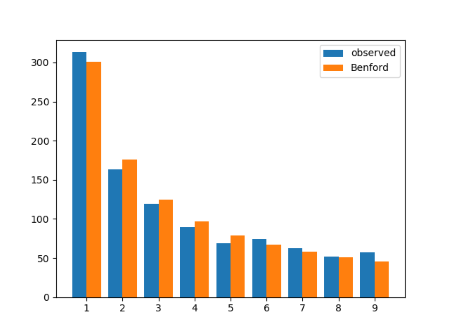
Problems with NHST
A common way to measure goodness of fit is to use a chi-square test. The null hypothesis would be that the data follow a Benford distribution. We look at the chi-square statistic for the observed data, based on a chi-square distribution with 8 degrees of freedom (one less than the number of categories, which is 9 because of the nine digits). We compute the p-value, the probability of seeing a chi-square statistic this larger or larger, and reject our null hypothesis if this p-value is too small.
Here’s how our chi-square values and p-values vary with sample size.
|-------------+------------+---------|
| Sample size | chi-square | p-value |
|-------------+------------+---------|
|          64 |     13.542 |  0.0945 |
|         128 |     10.438 |  0.2356 |
|         256 |     13.002 |  0.1118 |
|         512 |      8.213 |  0.4129 |
|        1024 |     10.434 |  0.2358 |
|        2048 |      6.652 |  0.5745 |
|        4096 |     15.966 |  0.0429 |
|        8192 |     20.181 |  0.0097 |
|       16384 |     31.855 | 9.9e-05 |
|       32768 |     45.336 | 3.2e-07 |
|-------------+------------+---------|
The p-values eventually get very small, but they don’t decrease monotonically with sample size. This is to be expected. If the data came from a Benford distribution, i.e. if the null hypothesis were true, we’d expect the p-values to be uniformly distributed, i.e. they’d be equally likely to take on any value between 0 and 1. And not until the two largest samples do we see values that don’t look consistent with uniform samples from [0, 1].
In one sense NHST has done its job. Cauchy samples do not exactly follow Benford’s law, and with enough data we can show this. But we’re rejecting a null hypothesis that isn’t that interesting. We’re showing that the data don’t exactly follow Benford’s law rather than showing that they do approximately follow Benford’s law.
Which is why I remind my biostatistics students that the chi-square test is a Badness of Fit Test, an instance that calls the whole NHST paradigm into question.
I’ve always felt this kind of goodness-of-fit NHST constitutes an abuse of the logic of significance testing.
The logic of NHST as I’ve always understood it is that you have some concrete hypothesis you wish to test. You test it with NHST by having the alternative hypothesis representing your concrete hypothesis and the null hypothesis represent some way in which your concrete hypothesis could be incorrect. If you then reject the significance test you have (to some degree of significance) ruled out your concrete hypothesis being incorrect in that particular way.
The whole goodness-of-fit test turns the entire logic on its head. Now, suddenly, the null hypothesis represents your concrete hypothesis, and you supposedly show it to be true by failing to reject it.
It seems to me that a proper goodness-of-fit NHST should start out with some measure of deviation between the sample and the distribution. Then the null hypothesis is that this deviation is greater than some case specific acceptable limit. Then if you reject the null you have shown (to some degree of significance) that the difference between the sample and the distribution is less that some relevant threshold.