This morning Patrick Honner posted the image below on Twitter.
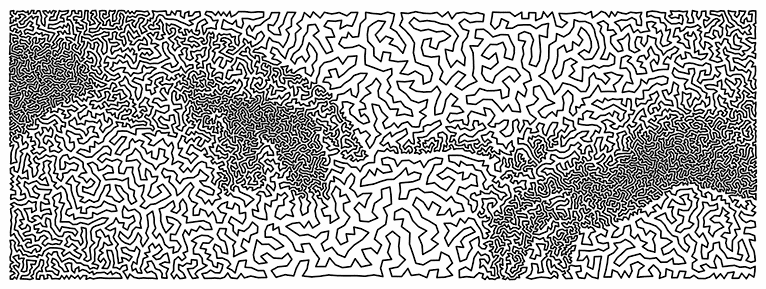
The image was created by Robert Bosch by solving a “traveling salesman” problem, finding a nearly optimal route for passing through 12,000 points.
I find this interesting for a couple reasons. For one thing, I remember when the traveling salesman problem was considered intractable. And in theory it still is! But in practice it is not difficult now to find nearly optimal solutions for very large traveling salesman problems.
Another reason I find this interesting is that there is a higher-level problem in the background, the problem of constructing a problem whose solution gives you a desired image.
Robert Bosch is showing us a solution to two problems. The image above is the solution to an optimization problem, and the problem it solves is itself the solution to another problem in the background. He’s doing a sort of inverse optimization, searching for an optimization problem. He goes into some of his techniques in his recent book Opt Art which I wrote about here.
This gets back to an argument I’ve had with statisticians who are resistant to innovative methods. They’ll say “But our method is optimal. You can’t do any better by definition. End of discussion!” But every method is optimal by some criteria. The question is whether the method is optimal by criteria appropriate to the problem at had or whether it is only optimal according to criteria that were mathematically convenient at the time it was formulated.
Robert Bosch has shown beautifully that any image can be viewed as the solution to an optimization problem. Of course the problem has to be crafted for the image. If he were solving a naturally occurring problem, such as planning a tour for an actual sales rep, and the solution had an uncanny resemblance to a piece of art by Michelangelo, that would be astounding.
A good comeback to “our method is optimal” is “that may be true on paper, but we don’t live on paper.”
My all-time favorite TSP algorithm is the meals-on-wheels algorithm of Bartholdi and Platzman (1982). The customer (who did not own a computer) needed to route delivery vehicles to a subset of N possible locations in Atlanta, with a different subset every day. The solution was to order the locations in the sequence they occur on a spacefilling curve, put them in a rolodex in that order, and tell the customer to schedule each day’s deliveries in rolodex order.
The solutions are near-optimal for the level of computational resources permitted.
@Vorquel honestly I find that a pretty content-free retort.
@David Tate funny, I was reading about something similar just recently… the supercomputing framework called SLURM uses a technique called “Hilbert curve scheduling” to allocate tasks to machines. My understanding is that every task is given a coordinate in an N-dimensional space (there being an assumption that “nearby” tasks in that space rely on some of the same data, therefore there’s a locality benefit to running them on the same node). So they draw a Hilbert curve through that space, sort the tasks by their order along the curve, and then divvy out contiguous slices. It’s not optimal but it’s reasonably close, and cheap (all the geometric stuff about Hilbert curves can be turned into some fairly simple bit manipulation on integers).
So how is the inverse optimization done? Clearly if points in an area are denser, the image will be darker in that area, but is there something more going on here?
@Nathan, that’s basically it. See the bottom of this post:
https://www.johndcook.com/blog/2012/05/01/traveling-salesman-art/
Fun fact, general TSP is still somewhat hard, but _metric_ TSP, where the underlying distances forms a metric is much easier due to many nice approximation algorithms. TSP in fixed-dimensional Euclidean space has a fully polynomial-time approximation scheme, which is a much lower bar in theory. Cf. [1] for more
[1]: https://cstheory.stackexchange.com/questions/9241/approximation-algorithms-for-metric-tsp