Here is a plot of the first 30 Chebyshev polynomials. Notice the interesting patterns in the white space.
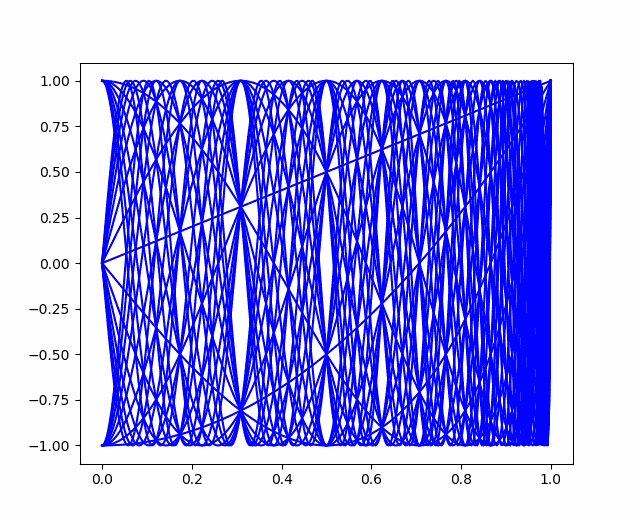
Forman Acton famously described Chebyshev polynomials as “cosine curves with a somewhat disturbed horizontal scale.” However, plotting cosines with frequencies 1 to 30 gives you pretty much a solid square. Something about the way Chebyshev polynomials disturb the horizontal scale creates the interesting pattern in negative space. (The distortion is different for each polynomial; otherwise the cosine picture would be a rescaling of the Chebyshev picture.)
I found the example above in a book that referenced a book by Theodore Rivlin. There’s a new edition of Rivlin’s book coming out in August, so maybe it will say something about the gaps.
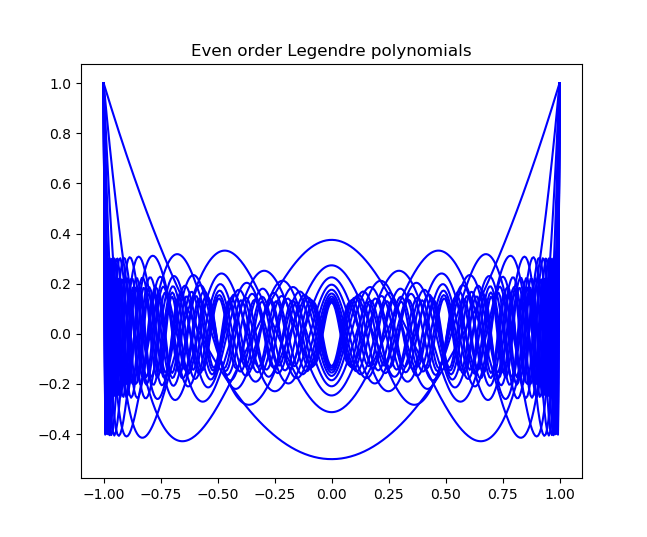
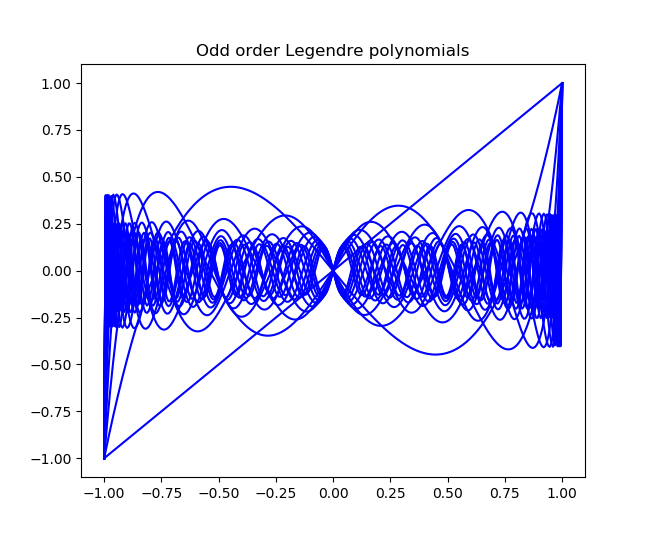
Update: Here are analogous graphs for Legendre polynomials, plotting the even and odd ordered polynomials separately. They also have conspicuous holes, but they don’t fill the unit square the way Chebyshev polynomials do.
Looking at the graph closely, it seems that the holes appear because, for some values of x, the sequence of Chebyshev polynomials take on a finite number of values.
This is not surprising because the Chebyshev recurrence relation does not depend on n, so if it ever returns to a previous state (for a fixed x) it will repeat the cycle infinitely.
I also get a solid square when I plot the cosines of frequencies from 1 to 30. But if you stretch the horizontal axis, the pattern becomes visible. I think it is actually clearer than for the Chebyshev polynomials.