Let Z be a standard normal random variable. Then there is a unique x such that
Pr(Z < x) = x.
That is, Φ has a unique fixed point where Φ is the CDF of a standard normal.
It’s easy to find the fixed point: start anywhere and iterate Φ.
Here’s a cobweb plot that shows how the iterates converge, starting with −2.
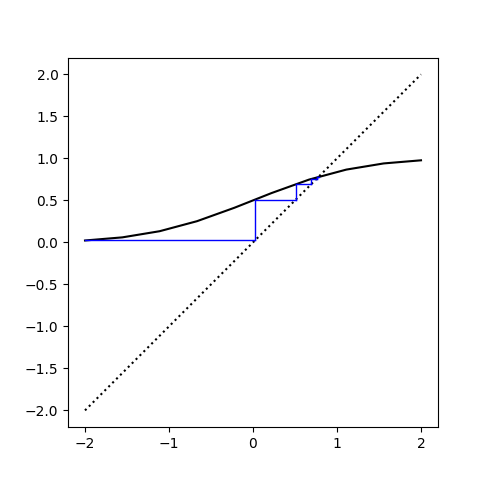
The black curve is a plot of Φ. The blue stairstep is a visualization of the iterates. The stairstep pattern comes from outputs turning into inputs. That is, vertical blue lines connect and input value x to its output value y, and the horizontal blue lines represent sliding a y value over to the dotted line y = x in order to turn it into the next x value.
y‘s become x‘s. The blue lines get short when we’re approaching the fixed point because now the outputs approximately equal the inputs.
Here’s a list of the first 10 iterates.
    0.02275
    0.50907
    0.69465
    0.75636
    0.77528
    0.78091
    0.78257
    0.78306
    0.78320
    0.78324
So it seems that after 10 iterations, we’ve converged to the fixed point in the first four decimal places.
Please, add connection (if any) of this to CVaR. Thanks.