The floor of a real number x, written ⌊x⌋, is the largest integer less than or equal to x. So, for example, ⌊π⌋ = 3 and ⌊−π⌋ = -4.
The previous post applied the floor function to a complex number z. What does that mean? You can’t just say it’s the largest integer [1] less than z because the complex numbers aren’t ordered; there’s no natural way to say whether one complex number is less than or greater than another.
The post was using Mathematica code, and Mathematica defines the floor of a complex number by applying the function to the real and imaginary parts separately. That is, if x and y are real numbers, then
⌊x + iy⌋ = ⌊x⌋ + i ⌊y⌋.
That lets you take the floor of a complex number, but is it useful? I wondered how many identities that hold for floors of real numbers extend to complex numbers when the floor is defined as above, so I looked at the chapter in Concrete Mathematics that has a bunch of identities involving floors and ceilings to see which ones extend to complex numbers.
Any identity where the real an imaginary parts don’t interact should extend trivially. For example, for real x and integer n,
⌊x + n⌋ = ⌊x⌋ + n.
This extends to the case where x is complex and n is a (complex) integer [1]. Addition works on real and imaginary components separately, just like Mathematica’s definition of floor.
But here’s one that’s much more interesting. For positive x,
⌊√⌊x⌋ ⌋ = ⌊√x⌋.
Taking square roots deeply intertwines the real and imaginary parts of a number [3]. Does the identity above hold for complex inputs?
I wrote some Python code to test this, and to my great surprise, the identity often holds. In my first experiment, it held something like 84% of the time for random inputs. I expected it would either rarely hold, or hold say half the time (e.g. in a half-plane).
My first thought was to plot 1,000 random points, green dots where the identity holds and red stars where it does not. This produced the following image.
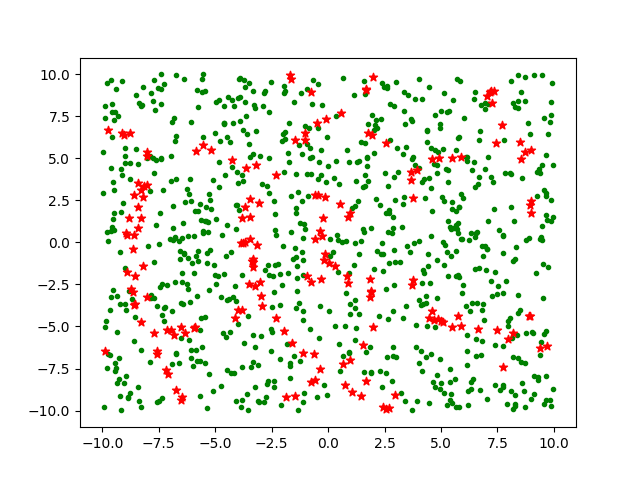
About 16% of the points are red and the rest green. In this plot there’s no apparent pattern to the red points.
Since I’m sampling uniformly throughout the square, there’s no reason to plot both where the identity holds and where it doesn’t. So for my next plot I just plotted where the identity fails.
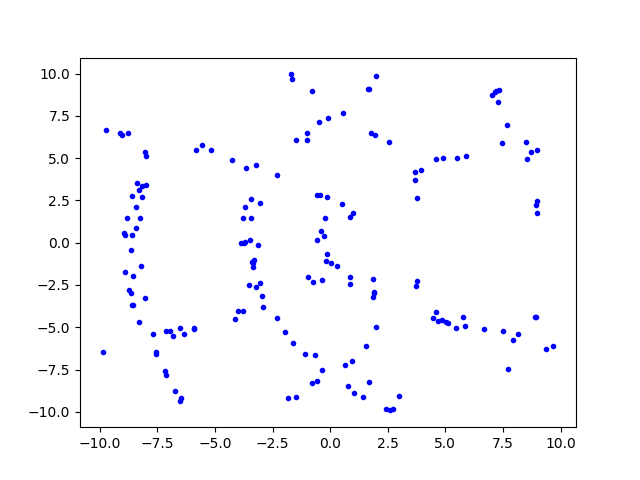
That’s a little clearer. To make it clearer, I rerun the plot with 10,000 samples. (That’s the total number of random samples tested, about 16% of which are plotted.)
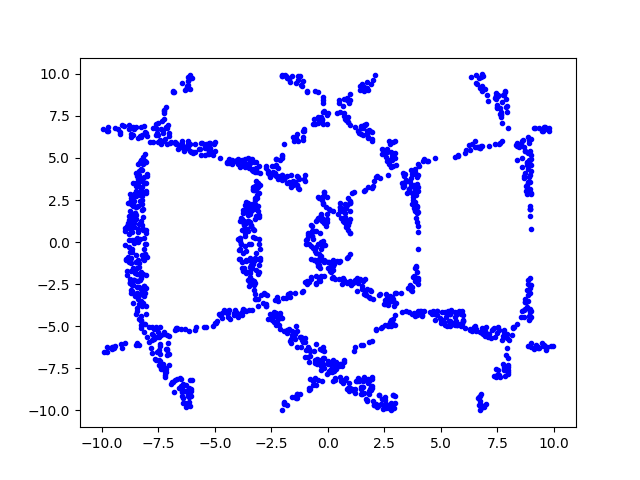
Then to improve the resolution even more, I increased the number of samples to 1,000,000.
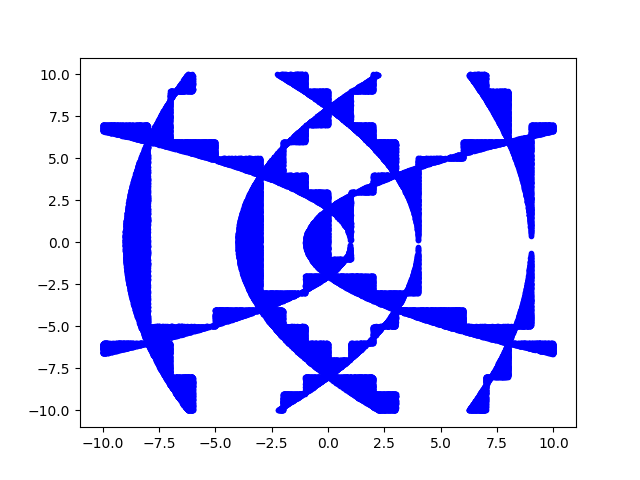
It might not be too hard to work out analytically the regions where the identity holds and doesn’t hold. The blue regions above look sorta like parabolas, which makes sense because square roots are involved. And these parabola-like curves has ziggurat-like embellishments, which makes sense because floors are involved.
Update
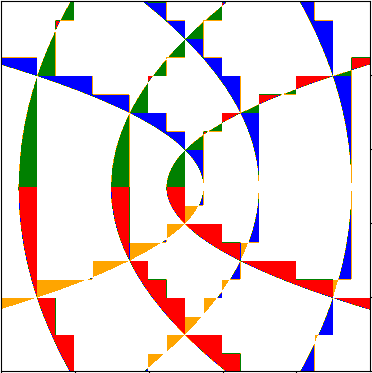
Define
f(z) = ⌊√⌊z⌋ ⌋ − ⌊√z⌋.
The graphs above plotted the set of zs for which f(z) ≠ 0. We can see more information by plotting f itself. The function only takes on five possible values: 0, 1, i, −1, and −i. I plotted these as white, orange, green, blue, and red.
Related posts
[1] You could extend the meaning of “integer” to a complex number with integer real and imaginary parts, commonly known as a Gaussian integer.
[2] I suspect Mathematica’s definition is not common. I don’t know of any other source that even defines the floor of a complex number, much less defines it as Mathematica does.
[3] You may be wondering what’s going on with the square root. Complex numbers have two square roots, so which one(s) are we using? I’m doing what Python does, taking the principal branch. That is, using the analytic continuation of square root that extends from the real axis to the complex plane with the negative real axis excluded.
I ran into the same problem (needing a complex floor function) while implementing Complex Continued Fractions, and quickly found there was no standard way to do it.
I ended up using “Nearest integer continued fractions” which add half to each of the real & imaginary parts and then floor each individually to create Gaussian Integers.
I believe there are other methods (like flooring just the real part) but I couldn’t get my CF’s to work properly using this scheme.
Shifting the integer lattice by half like this, makes me wonder what implementing the CF algo would be like if I used Eisenstein Integers instead? A little project for a more mathematically inclined person than myself, methinks?…
Another definition of complex floor comes from the APL language. See https://www.jsoftware.com/papers/eem/complexfloor.htm .
I found this post pretty interesting especially after the last since I’d never seen the definition for complex numbers.
I tried to recreate your graphs in Python and I can see the same basic structure, but it seems to have clumps of points in certain locations instead of easily seen arcs. So if you wouldn’t mind sharing I’d like to study it as I’m relatively new to Python.
Also I was looking at James Paget’s link for APL. I also implemented that into Python and saw roughly the same shape but given the definitions its not one to one. I’m still working through why the conditions are given from the list of requirements but it is interesting.
Mathematica floor satisfies 6 out of the 7 McDonnell requirements for APL floor, failing on
3. Fractionality: The magnitude of the difference of a number and its floor shall be less than one. This property must be satisfied to guarantee that remainders are less in magnitude than divisors. It may be called the fundamental property of the floor function.
Thus APL floor might be the better choice.
Flooring to an Eisenstein integer could be an interesting alternative. At least it satisfies the McDonnell fractionality requirement.