The test statistic in the t-test does not exactly follow a Student t distribution except under ideal conditions.
If you’re comparing data from two normally distributed populations to see whether they have the same mean, the test statistic for the two-sample t-test does not have a t distribution unless the two populations have equal variance.
Robustness
Maybe this isn’t a problem. Your data didn’t exactly come from a normal distribution, so maybe it doesn’t matter that the test statistic doesn’t exactly have a t distribution. It’s a matter of robustness.
I’ve written before about the robustness of the t-test to violations of the normality assumption. In that post I assumed two populations have the same variance, but not a normal distribution. The conclusion was that departures from the normal distribution don’t matter so much, but departures from symmetry do.
For this post we’ll keep the normality assumption but have unequal variances. We know that the distribution of the test statistic is approximately, but not exactly, a t distribution. But what distribution does it have? I’ve seen it called “not pleasant” [1] but I haven’t seen a plot of it, so I’m curious.
Details
Suppose we have n samples from a random variable X and m samples from a random variable Y, and that the sample variances for the two samples are sX and sY respectively. Our test statistic for equality of the two means is

Sattertwhaite’s approximation for the distribution on T is a Student t distribution with degrees of freedom equal to

This is known as the Welch-Satterthrwaite equation.
There are numerous minor variations on the two-sample t-test, and the one using degrees of freedom in the Welch-Satterthrwaite equation is known as Welch’s t-test.
Simulation
For simulation I let X be a normal random variable with mean 100 and standard deviation 1, and Y be a normal random variable with mean 100 and standard deviation 50. I drew 15 samples from X and 12 from Y and computed the statistic T. I did this 10,000 times and plotted a histogram of the values of T. The result has very nearly a t distribution.
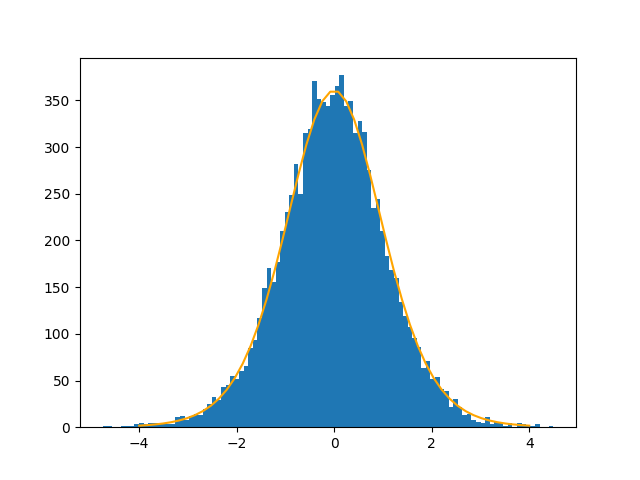
At least in this example, any deviance from the t distribution is minor. Welch’s t-test is said to be robust to differences in variance, and this is an example of it living up to its reputation.
Related posts
[1] Casella and Berger, Statistical Inference.