Vowel sounds can be visualized in a two-dimensional space according to tongue position. The vertical axis is runs from open down to closed, and the horizontal runs from front to back. See a linguistics textbook for far more detail.
English has five vowel letters, but a lot more than five vowel sounds. Scholars argue about how many vowel sounds English and other languages have because there’s room for disagreement on how much two sounds can differ and still be considered variations on the same sound. The IPA Handbook [1] lists 11 vowel sounds in American English, not counting diphthongs.
When I wrote about Japanese hiragana and katakana recently, I showed how the letters are arranged into a grid with one side labeled with English vowel letters. Is that justified? Does Japanese really have just five vowel sounds, and are they similar to five English vowels? Essentially yes. This post will show how English and Japanese vowel sounds compare according to [1].
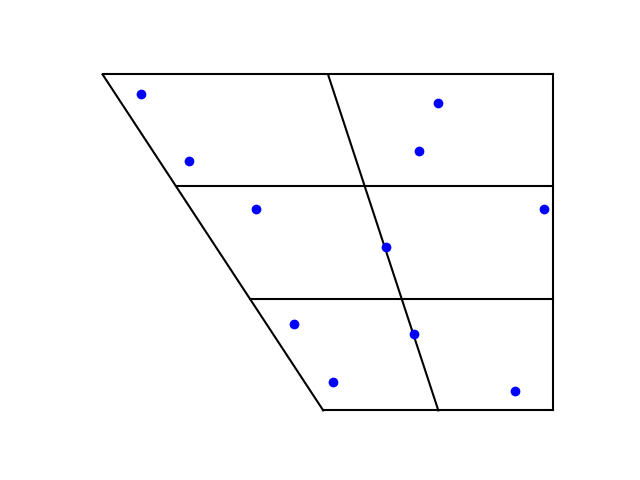
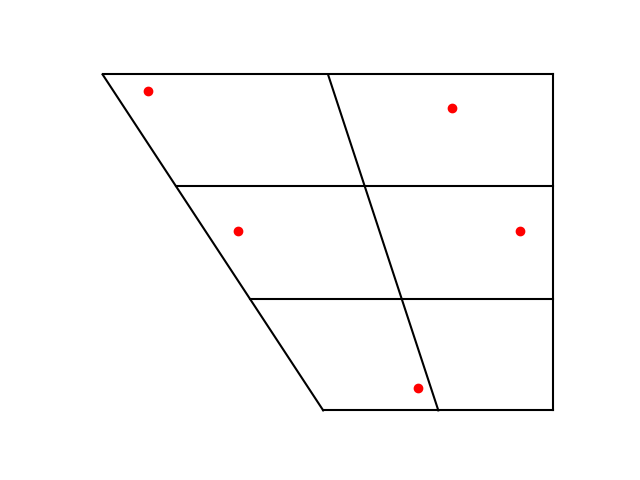
Here are versions of the vowel charts for the two languages that I made using Python’s matplotlib.
First English:
Then Japanese:
And now the two combined on one plot:
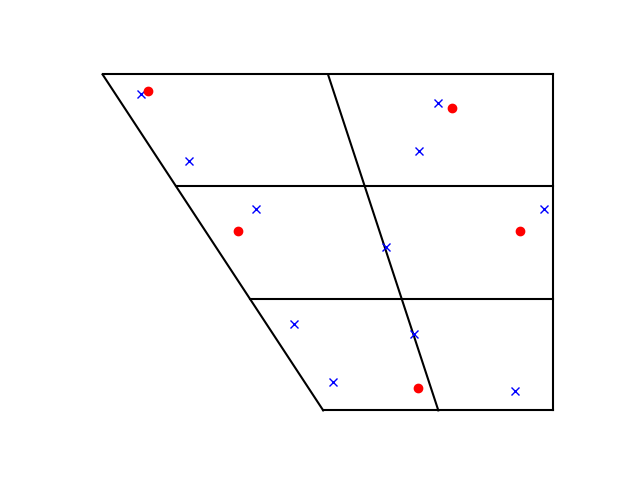
Four out of the five Japanese vowels have a near equivalent in English. The exception is the Japanese vowel with IPA symbol ‘a’, which is midway between the English vowels with symbols æ (U+0230) and ɑ (U+0251), somewhere between the a in had and the a in father.
Update: See the comments for a acoustic phonetician’s input regarding frequency analysis.
Update: Here is a similar post for Swedish. Swedish is interesting because it has a lot of vowel sounds, and the sounds are in tight clusters.
Analogy with KL divergence
The differences between English and Japanese vowels are asymmetric: an English speaker will find it easier to learn Japanese vowels than a Japanese speaker would find it to learn English vowels. This reminiscent of the Kullback-Leibler divergence in probability and statistics.
KL-divergence is a divergence and not a distance, even though it is often called a distance, because it’s not symmetric. The KL-divergence between two random variables X and Y, written KL(X || Y), is the average surprise in seeing Y when you expected X. If you expect English vowel sounds and hear Japanese vowel sounds you’re not as surprised as if you expect Japanese vowel sounds and hear English. The English student of Japanese hears familiar sounds shifted a bit, but the Japanese student of English hears new sounds.
Related posts
[1] Handbook of the International Phonetic Association: A Guide to the Use of the International Phonetic Alphabet. Cambridge University Press, 2021.
“Vowel sounds can be visualized in a two-dimensional space according to tongue position. The vertical axis is runs from open down to closed, and the horizontal runs from front to back.”
More than that (putting on my acoustic phonetician hat, since one of my qualifying papers was an instrumental study of the Mongolian vowel system conducted in just this way), each axis corresponds to the frequency of one of the two lowest resonance frequencies of the vocal tract (the formants–the third formant in combination with the second is associated with the degree of lip rounding); with suitable scaling (read about the Bark scale), you can run a FFT on the speech signal and plot the vowel formants to get the tongue position with fair accuracy.
It works in the most basic sense essentially because the articulators are located in the top half of the vocal tract, so there’s a one-to-one mapping of position to formant frequencies. Another reason it works is that to a good first approximation, you can model the vocal tract for any vowel as two cylinders of air connected by a narrower cylinder for the place of articulation of the tongue and a correction for lip rounding. This model is associated with Gunnar Fant, if you’re curious, as in his Acoustic Theory of Speech Production (1945, I think, though the edition I have is from 1960).
This also has important implications for babies learning how to make vowels: There’s a close association inherent to the vocal tract between tongue position and sound that makes learning vowel production an easy task.
Also, one interesting note: If you treat the vocal tract as a single pipe without any narrowing–the neutral configuration, as it’s called, corresponding to the schwa vowel–you find the resonance frequencies are in 1:3:5:7… ratios. Using basic acoustics and a simple end correction for the lips, you find that the theoretical frequencies of the formants of a schwa in typical men’s speech (typical in length of the vocal tract) are around 500 Hz, 1500 Hz, 2500 Hz, etc. Which, I was amazed to find, were very close to the formants of my own schwa vowel when I recorded it (like 1-2% off for all three).