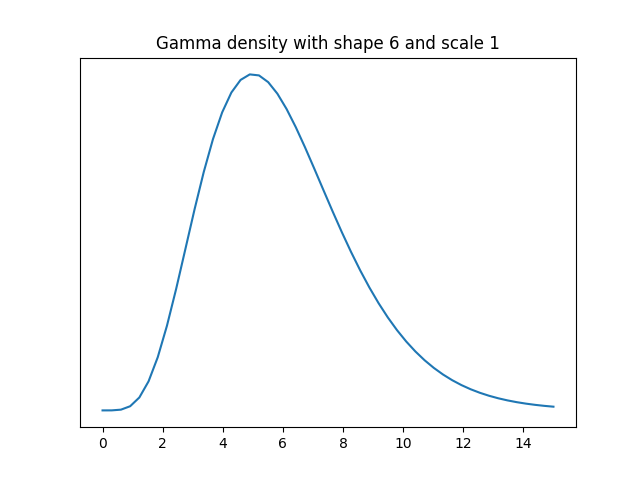
Let’s suppose we have data that comes from a distribution that is approximately normal but has a heavier right tail, specifically a gamma distribution with shape 6.
We’d like to estimate the standard deviation of the data source. If the data were normally distributed, the sample standard deviation would be the most efficient unbiased estimator. But what about this example where the data are roughly normally distributed? How well does sample standard deviation compare to the mean range? Following the convention of ANSI Z1.4 we’ll average the ranges of samples of 5.
The variance of a gamma random variable with scale 1 is equal to its shape parameter, so our data has variance 6, and so standard deviation √6. We will pretend that we don’t know this and see how well we can infer this value using random samples. We’ll compare the statistical efficiency of the mean of the ranges of k samples of 5 each and the standard deviation based on 5k samples for k = 2 and 4.
First we’ll use the following code to estimate the population standard deviation with 10 samples two ways: with sample standard deviation and with the average of the range of two samples of 5. We’ll take the absolute value of the difference between each estimate and the true value, and repeat this 1,000 times to simulate the mean absolute error.
    from scipy.stats import gamma, t

    def meanrange(y, k):
        scale = 0.430 # scale factor for n=5
        s = 0
        for i in range(k):
            sample = y[5*i:5*(i+1)]
            s += max(sample) - min(sample)
        return scale*s/k

    n = 5
    k = 2
    shape = 6
    sigma = shape**0.5

    stderr = 0
    mrerr = 0
    N = 1000
    for _ in range(N):
        y = gamma(shape).rvs(size=n*k)
        std = y.std(ddof=1)
        mr = meanrange(y, k)
        stderr += abs(std-sigma)
        mrerr += abs(mr-sigma)
    print(stderr/N, mrerr/N)
The mean absolute error was 0.532 using sample standard deviation and 0.550 using mean range.
When I changed k to 4, the mean absolute error using the sample standard deviation was 0.377. The mean absolute error using the range of 4 samples of 5 each time was 0.402.
The error in both methods was comparable, though the sample standard deviation did slightly better.
Next I repeated the experiment drawing samples from a Student t distribution with 3 degrees of freedom, a distribution with heavy tails.
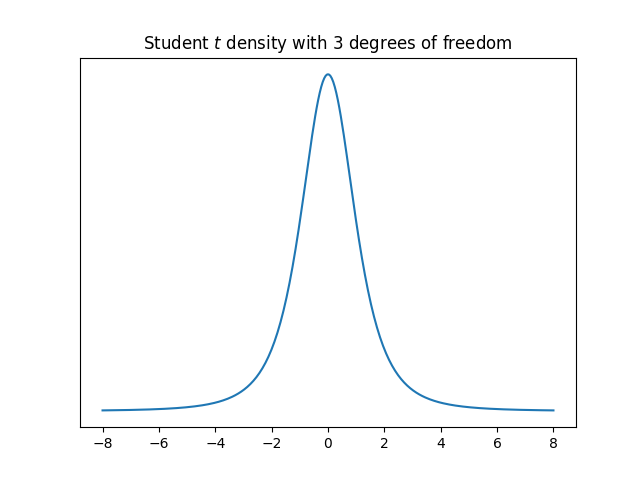
When k = 2, the mean absolute errors were 0.603 and 0.574 for sample standard deviation and mean range respectively. When k = 4, the errors were 0.484 and 0.431. Again the errors are comparable, but this time the mean range was more accurate.
Sorry to be the bearer of bad news, but while the sample variance (divide sum of square difference from sample mean by by N – 1) is an unbiased estimator for variance, the sample standard deviation (sqrt of sample variance) is not an unbiased estimator for standard deviation (though it’s close). There’s no simple unbiased estimator for standard deviation, but the Wikipedia page on unbiased estimation of standard deviation explains how to adjust for given sample sizes in certain conditions derived from quality control (and thus relating to your previous posts).
Bias is defined as expected error. So we can measure that by removing the absolute values from your code and generating a larger sample (N = 1e6), which yields average errors of
0.0063 0.2617,
which shows the sample variance is basically unbiased, whereas the square of the mean range estimator is positively biased (though I’m not sure squaring the mean range estimate of standard deviation is how they’d estimate variance).
If we repeat the experiment for standard deviation rather than variance, I get
-0.088 -0.046,
which shows that there’s residual negative bias, which is about half for the mean range estimator. I started with N = 1e4 and kept raising N until I got to 1e6 and the expected error for sample variance goes down but the expected standard error for standard deviation does not. It’s hard to report all this stuff in a reply to a blog post.
The second issue here is using absolute error, which is not a proper scoring rule (there’s another Wikipedia page explaining this concept—log loss is another proper scoring rule, whereas 0/1 loss is another improper rule). If we repeat the experiments using square error on standard deviations rather than absolute error, I get
0.43 0.49,
which is at least the same ordering, but shows the two estimators to be much closer. The ordering can flip between absolute and square error, for instance with Bayesian posterior predictive inference vs. plugging in penalized MLE for logistic regression.