The previous post mentioned the group S4, the group of all permutations of a set with four elements. This post will show a way to visualize this group.
The Mathematica command
    CayleyGraph[
        SymmetricGroup[4],
        VertexLabels -> Placed["Name", Center],
        VertexSize -> 0.4]
generates the graph below.
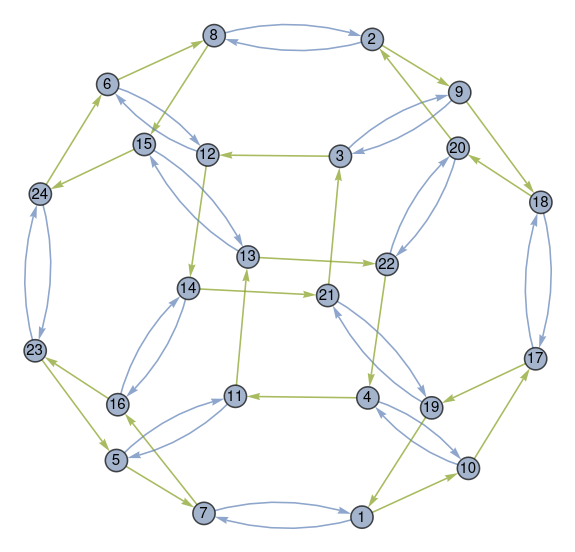
This is an interesting image, but what does it mean?
The elements of S4 are represented by the circled numbers. The numbers correspond to the permutations of four elements, listed in lexicographical order. If you label the four elements a, b, c, and d then the permutations are listed in alphabetical order. Permutation 1 is [1, 2, 3, 4] to itself and Permutation 24 is its reverse [4, 3, 2, 1].
In the Mathematica application, mousing over a number shows which permutation it represents, though the static image above doesn’t have this feature.
The blue arrows represent the permutation that swaps the first two elements. So the blue arrow between node 1 and node 7 says that swapping the first two elements of Permutation 1 gives you Permutation 7, which is [2, 1, 3, 4]. The blue arrow going back from 7 to 1 says that the same swapping operation applied to Permutation 7 returns you to Permutation 1.
All the blue arrows come in pairs because swapping is its own inverse.
The green arrows represent a rotation. For example, the green arrow from 1 to 10 says that rotation turns [1, 2, 3, 4] into [2, 3, 4, 1]. The rotation operation is not its own inverse, so the arrows only go in one direction. But every green arrow is part of a diamond because applying the rotation operation four times sends you back where you started.
You can get from any permutation to any other permutation by repeatedly either swapping the first two elements or applying a rotation. In group theoretical terminology, these two permutations generate the group S4.