The Allee effect is named after Warder Clyde Allee who added a term to the famous logistic equation. His added term is highlighted in blue.
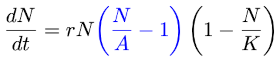
Here N is the population of a species over time, r is the intrinsic rate of increase, K is the carrying capacity, and A is the critical point.
If you remove Allee’s term, you get an equation saying that the rate of growth of a population is proportional to the current population size, and so growth starts out exponential, and a term (1 – N/K), which says growth slows down as the population approaches its carrying capacity.
Allee’s term (N/A – 1) says that the rate of growth becomes negative when the population falls below some threshold A. When there are too few individuals, survival becomes more difficult.
Software metaphor
I thought of the Allee effect as a metaphor for software technology after writing my previous post. In general, problems become easier to solve over time. Software development may become harder because the problems developers solve are changing, but solving old problems typically gets easier. Algorithms improve and get wrapped up for convenience. There’s something like logistic growth where tasks get easier to solve, but improvement slows down over time.
If a problem is specialized, it can run into something like the Allee effect. It becomes harder over time because fewer people are interested in it. Software isn’t maintained as fast as it degrades. Fewer people have experience with it. It’s harder to be a COBOL programmer, for example, than it used to be. But this can also apply to much more current problems. A problem that was hot five years ago can be harder to solve now than it was then, for reasons the previous post discusses.
Please can you highlight in blue not red. The red/black contrast is not enough for color blind people (8% of men)
Thanks Matt. I updated the image.
I try to do things like use solid lines and dashed lines when making plots for this reason. I don’t know how to do anything analogous to that for LaTeX equations.
Good to know that more people could see blue than red. I didn’t know that.