Math books often use some illustration from the book contents as cover art. When they do, there’s often some mystery to the cover art, and a sense of accomplishment when you get far enough into the book to understand the significance of the cover. (See examples here.)
William L. Briggs and Van Emden Henson wrote such a book, The DFT: An Owner’s Manual for the Discrete Fourier Transform. The cover features the following image.
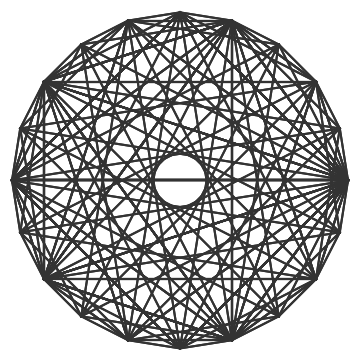
At first glance, this image might look like a complete graph, one with an edge from every node along the circle to every other node. But that’s not it. For one thing, there’s only one line that goes through the center of the circle. And when you look closer it’s not as symmetric as it may have seemed at first.
Here’s the same image plotted in blue, except this time I reduced the alpha channel of the lines. Making the lines less opaque makes it possible to see that some lines are drawn more often than others, the darker lines being the ones that have been traced more than once.
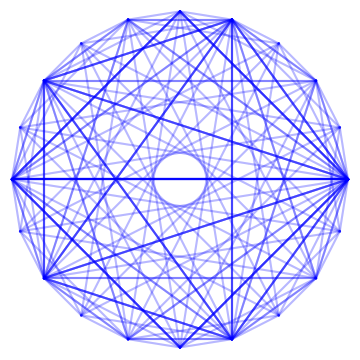
What does this drawing represent? The explanation is given in the last exercise at the end of the first chapter.
The cover and frontmatter of this book display several polygonal, mandala-shaped figures which were generated using the DFT.
The exercise goes into some detail and invites the reader to reproduce versions of the cover figure with N = 4 or N = 8 nodes around the circle. For n from 1 to N, take the DFT (discrete Fourier transform) of the nth standard basis vector en and draw lines connecting the components of the DFT. These components are
Fk = exp(-2πink/N) / N
for k = 1 to N.
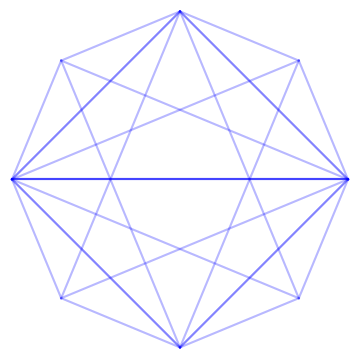
The cover also has smaller figures which correspond to the same sort of image for other values of N. For example, here is the figure for N = 8.