About three years ago I ran across a strange coordinate system in which familiar functions lead to interesting plots. The system is called “circular coordinates” but it is not polar coordinates.
This morning I was playing around with this again.
Here’s a plot of f(x) = x.
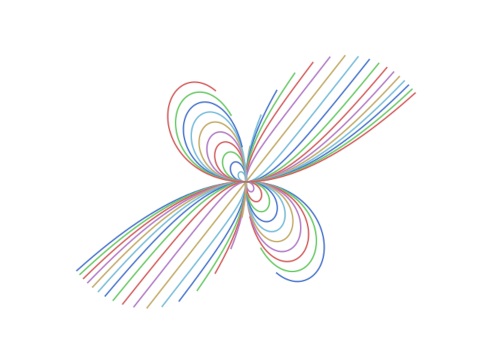
And here’s a plot of f(x) = cos(8x).

See this post for details of circular coordinates.
Here is Python code to make the plots. You can experiment with your own plots by changing the definition of f.
# See Mathematics Magazine, v 52 no 3, p175

from numpy import cos
from numpy import linspace
import matplotlib.pyplot as plt

plt.style.use('seaborn-v0_8-muted')

def g(u, c, f):
    t = f(u) + c

    return 2*u*t**2 / (u**2 + t**2)

def h(u, c, f):
    t = f(u) + c
    return 2*u*u*t / (u**2 + t**2)

t = linspace(-7, 7, 10000)
fig, ax = plt.subplots()
f = lambda x: cos(8*x)
for c in range(-10, 11):
    ax.plot(g(t, c, f), h(t, c, f))
    plt.axis("off")
plt.show()