Suppose that when Team X and Team Y play, the probability that X will win a single game is p and the probability that Y will win is q = 1 − p.
What is the probability that X will win the majority of a series of N games for some odd number N?
We know intuitively that the team more likely to win each game is more likely to win the series. But how much more likely?
We also know intuitively that the more games in the series, the more likely the better team will win. But how much more likely?
The probability of X winning a series of N games is
![]()
It doesn’t matter that maybe not all games are played: some games may not be played precisely because it makes no difference whether they are played. For example, if one team wins the first three in a best-of-five series, the last two games are not played, but for our purposes we may imagine that they were played.
Let’s plot the probability of X winning a best-of-five series and a best-of-seven series.
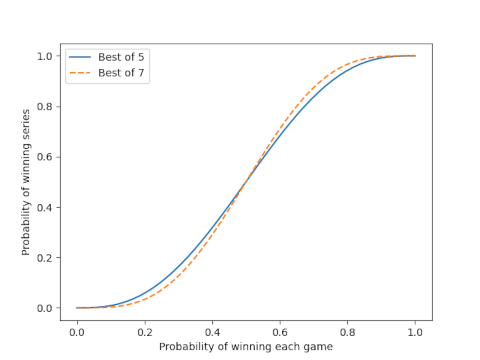
The better team is more likely to win a series than a game. The probability of the better team winning a single game would be a diagonal line running from (0, 0) to (1, 1). The curves for a series are below this line to the left of 0.5 and above this line to the right of 0.5. But the difference between a best-of-five and a best-of-seven series is small.
Here’s another plot looking at the difference in probabilities, probability of winning best-of-seven minus probability of winning best-of-five.
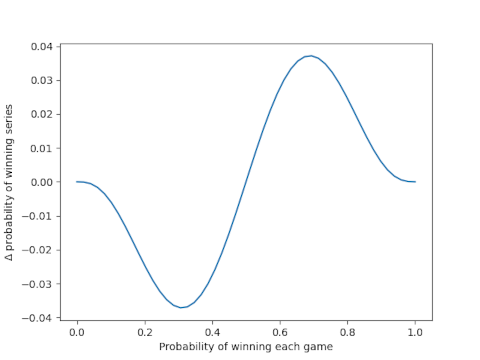
The maximum difference is between 3% and 4%.
This assumes the probability of winning a game is constant and that games are independent. This is not exactly the case in, for example, the World Series in which human factors make things more complicated.
I’d love to see the first graph augmented with a best-of-three curve.
Of course the home advantage in three home games verses four home games may be greater than the advantage difference in seven games on neutral field.