Angela Duckworth gave a 90-second talk entitled Why Achievement Isn’t Normal.
She’s using the term “normal” in the sense of the normal (Gaussian) distribution, the bell curve. With normally distributed attributes, such as height, most people are near the middle and very few are far from the middle. Also, the distribution is symmetric: as many people are likely to be above the middle as below.
Achievement is not like that in many fields. The highest achievers achieve far more than average. The best programmers may be 100 times more productive than average programmers. The wealthiest people have orders of magnitude more wealth than average. Best selling authors far outsell average authors.
Angela Duckworth says achievement is not normal, it’s log-normal. The log-normal distribution is skewed to the right. It has a long tail, meaning that values far from the mean are fairly common. The idea of using a long-tailed distribution makes sense, but I don’t understand the justification for the log-normal distribution in particular given in the video. This is not to disparage the speaker. No one can give a detailed derivation of a statistical distribution in 90 seconds. I’ll give a plausibility argument below. If you’re not interested in the math, just scroll down to the graph at the bottom.
The factors that contribute to achievement are often multiplicative. That is, advantages multiply rather than add. If your first book is a success, more people will give your second book a chance. Your readership doesn’t simply add, as if each book were written by a different person. Instead, your audience compounds. Websites with more inbound links get a higher search engine rank. More people find these sites because of their ranking, and so more people link to them, and the ranking goes up. Skills like communication and organization don’t just contribute additively as they would on a report card; they are multipliers that amplify your effectiveness in other areas.
The log-normal distribution has two parameters: μ and σ. These look like the mean and standard deviation parameters, but they are not the mean and standard deviation of the log-normal. If X is a log-normal(μ , σ) random variable, then log(X) has a normal(μ, σ) distribution. The parameters μ and σ are not the mean and standard deviation of X but of log(X).
The product of two log-normal distributions is log-normal because the sum of two normal distributions is normal. So if the contributions to achievement are multiplicative, log-normal distributions will be convenient to model achievement.
I said earlier that log-normal distributions are skewed. I’ve got something of a circular argument if I start with the assumption that the factors that contribute to achievement are skewed and then conclude that achievement is skewed. But log-normal distributions have varying degrees of skewness. When σ is small, the distribution is approximately normal. So you could start with individual factors that have a nearly normal distribution, modeled by a log-normal distribution. Then you can show that as you multiply these together, you get a distribution more skewed than it’s inputs.
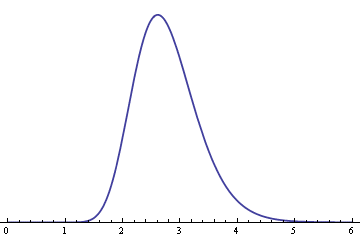
Suppose you have n random variables that have a log-normal(1, σ) distribution. Their product will have a log-normal(n, √n σ) distribution. As n increases, the distribution of the product becomes more skewed. Here is an example. The following graph shows the density of a log-normal(1, 0.2) distribution.
Here is the distribution of the product of nine independent copies of the above distribution, a log-normal(9, 0.6) distribution.
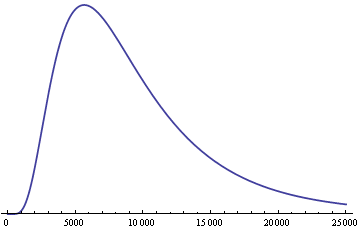
So even though the original distribution is symmetric and concentrated near the middle, the product of nine independent copies has a long tail to the right.
Related posts
- Small advantages show up in the extremes
- Variation in male and female Olympic performance: Part 1, Part 2
- Evaluate people at their best or at their worst?
Most distributions aren’t anything at all. There are some distributions that allow arbitrary skewness and kurtosis and these seem the best option for tail probabilities, for when you need something like that, for example child growth.
I’ve wiped all the silly examples about normal probabilities from my service stats course. Questions like the time to do something is normal mean 10s sd 2 s, what is the probability that someone will finish in 9s. I do talk about means, the central limit theorem does work well.
I’d like to see the data showing conclusively that achievement is log-normally distributed. Many people are happy with the assumption that equity return are lognormal, but they are not. Perhaps “achievement” is better described by a gamma distribution, which is very flexible and has desirable scaling properties.
Incidentally, sometimes the term “long tail” is used interchangeably by “heavy tail”. But log-normal r.v.s are not heavy-tailed, and that jibes with intuition: if that were the case for achievement, then with high probability the advances to any given field who be contributed by a single individual.
I don’t take this too seriously; it’s just a plausibility argument.
I would expect individual wealth to follow a Zipf distribution — but that’s not a “distribution” in the sense of a probability distribution. What kind of pdf would produce a Zipf distribution? I’m too ignorant to know.
Measurements of physical growth such as height are log normal so her very first example of a normal distribution is wrong. The idea is good but in reality, most things are a combination of normal and log normal distribution in that there are additive as well as multiplicative components. Of course, the multiplicative components should dominate so most things are more accurately modeled with a log normal distribution than a normal distribution. Of course, all of these distributions are inherently wrong, they assume an infinite number of factors, yes there is a large number of factors but it isn’t infinite.
One important aspect of log normal is that it’s undefined for X less than zero, in other words, it starts at zero and goes to infinity whereas normal distribution is from minus infinity to positive infinity. Mean times to repair should be analyzed as log normal distribution since it’s not likely to be a negative value, obviously not all factors affecting time to repair are multiplicative but that very critical nature of starting at zero makes a world of difference.
Good topic for a speech but terrible research and content.
Beautifully articulated. I liked the analogy of book readership, and the way the discussion has been presented about Achievement being non-normal and appearing as log-normal.
Kragen is right generally. Extreme values from the normal are demonstrably Gumbel distributed.
This is a good start, and I’ll agree the math is plausible, but it still isn’t clear to me that the factors behind achievement are multiplicative.
If you started with a bunch of positive random variables X_i, which are bounded away from 0 and infinity, then you could take log of them, to get log(X_i), which would be bounded. You could apply the central limit theorem to these, do find that their sum would be approximately normal. This would suggest that the product of the original variables would be tending to a log normal, in some suitable sense?
[Of course, you could use looser constraints on the original variables than bounding them away from 0 and infinity, and could also look at the scaling of the variance to see if you’re likely to see an approximately normal result in the sense you describe above?]
Anything cognitive will be expressed in all mathematics on logrithmic scales. People have cognitive limits. Their cognitive limit is the base of their log scale. Media that are cognitive are also expressed on logrithmic scales. Powerpoint slides have a cognitive limit of three. Twitter would have a smilar limit.
Just looking at the distribution, it is just a skewed normal. The long tail results from the skew.