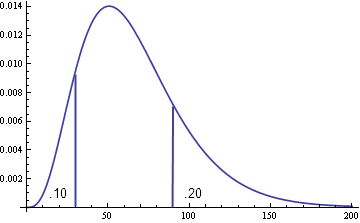
The doctor says 10% of patients respond within 30 days of treatment and 80% respond within 90 days of treatment. Now go turn that into a probability distribution. That’s a common task in Bayesian statistics, capturing expert opinion in a mathematical form to create a prior distribution.
Things would be easier if you could ask subject matter experts to express their opinions in statistical terms. You could ask “If you were to represent your belief as a gamma distribution, what would the shape and scale parameters be?” But that’s ridiculous. Even if they understood the question, it’s unlikely they’d give an accurate answer. It’s easier to think in terms of percentiles.
Asking for mean and variance are not much better than asking for shape and scale, especially for a non-symmetric distribution such as a survival curve. Anyone who knows what variance is probably thinks about it in terms of a normal distribution. Asking for mean and variance encourages someone to think about a symmetric distribution.
So once you have specified a couple percentiles, such as the example this post started with, can you find parameters that meet these requirements? If you can’t meet both requirements, how close can you come to satisfying them? Does it depend on how far apart the percentiles are? The answers to these questions depend on the distribution family. Obviously you can’t satisfy two requirements with a one-parameter distribution in general. If you have two requirements and two parameters, at least it’s feasible that both can be satisfied.
If you have a random variable X whose distribution depends on two parameters, when can you find parameter values so that Prob(X ≤ x1) = p1 and Prob(X ≤ x2) = p2? For starters, if x1 is less than x2 then p1 must be less than p2. For example, the probability of a variable being less than 5 cannot be bigger than the probability of being less than 6. For some common distributions, the only requirement is this requirement that the x‘s and p‘s be in a consistent order.
For a location-scale family, such as the normal or Cauchy distributions, you can always find a location and scale parameter to satisfy two percentile conditions. In fact, there’s a simple expression for the parameters. The location parameter is given by

and the scale parameter is given by

where F(x) is the CDF of the distribution representative with location 0 and scale 1.
The shape and scale parameters of a Weibull distribution can also be found in closed form. For a gamma distribution, parameters to satisfy the percentile requirements always exist. The parameters are easy to determine numerically but there is no simple expression for them.
For more details, see Determining distribution parameters from quantiles. See also the ParameterSolver software.
Update: I posted an article on CodeProject with Python code for computing the parameters described here.
This is cool!
Super awesome. In addition to the practical problem you’ve solved (and could there be survey applications? customer response? employee preference? dating sites?) it makes me think of several abstract issues.
For one, what’s the minimum storage size of a distribution? If you manually specified “all” of the percentiles of the exponential distribution, it could take an infinite amount of storage space, right? But you only need one parameter (or should I say three: base, λ, and the function definition) to generate it. On the other hand what’s so special about the functions that we know? A sum of exponentials is simple in some other linear basis but I can’t think of a cheap way to store that in a computer.
For two, every probability distribution is just a 1-generalised function s.t. ∫ƒ is a function while ƒ is not guaranteed to be one. Which is why it makes sense to store the CDF’s (they’re also monotonic which has to be good for making them small in some way). So now chase the diagram backwards: your solution with storing percentiles of CDF’s is applicable to any 1-generalised function. Does that buy us anything for free?
Well, that is a useful post. I shall add that we can elicit the judgements using an alternative way by asking the “expert” to provide e.g. the lower and upper quartiles.
In regard to how to assess the fitted distribution then we may use the feedback stage by reporting to the “expert” properties of the fitted distribution for confirmation.
As usual I tried solving it first before reading your solution, and for once I got it right! (I am a stats novice, so that is an accomplishment for me.) My method was to first scale in order to find the standard deviation, then multiply the standard deviation by the standard quantile of p1 to figure out how far q1 is from the mean. I think that is mathematically equivalent to what you showed. Here is my R code using a normal distribution:
p1 <- .1

p2 <- .8

q1 <- 30

q2 <- 90
# scale to find the sd:
sd <- (q2 - q1) / (qnorm(p2) - qnorm(p1))
# multiply sd by standard quantile to find the mean:
mu 0.1
pnorm(90, mu, sd) # => 0.8
*Oops, the code above should read:
p1 <- .1
p2 <- .8
q1 <- 30
q2 <- 90
# scale to find the sd:
sd <- (q2 – q1) / (qnorm(p2) – qnorm(p1))
# use a given quantile and sd to find the mean:
mu <- q1 – qnorm(p1) * sd
# check for correctness:
pnorm(30, mu, sd)
pnorm(90, mu, sd)
I recently read Morgan2014, Use (and abuse) of expert elicitation in support of decision making for public policy.
In it there are some nice tips on how to ask if you want more info on the shape. It is also good to be aware of the ubiquitous over confidence.
http://www.ncbi.nlm.nih.gov/pubmed/24821779
Thank you for deriving these useful equations. I have a similar stddev determination problem, in which only the difference p2-p1 is known along with mean of the (normal) distribution and x1 and x2.
How can I determine the standard deviation given this knowledge?