In many networks—social networks, electrical power networks, networks of web pages, etc.—the number of connections for each node follows a statistical distribution known as a power law. Here’s a model of network formation that shows how power laws can emerge from very simple rules.
Albert-László Barabási describes the following algorithm in his book Linked. Create a network by starting with two connected nodes. Then add nodes one at a time. Every time a new node joins the network, it connects to two older nodes at random with probability proportional to the number of links the old nodes have. That is, nodes that already have more links are more likely to get new links. If a node has three times as many links as another node, then it’s three times as attractive to new nodes. The rich get richer, just like with Page Rank.
Barabási says this algorithm produces networks whose connectivity distribution follows a power law. That is, the number of nodes with n connections is proportional to n−k. In particular he says k = 3.
I wrote some code to play with this algorithm. As the saying goes, programming is understanding. There were aspects of the algorithm I never would have noticed had I not written code for it. For one thing, after I decided to write a program I had to read the description more carefully and I noticed I’d misunderstood a couple details.
If the number of nodes with n connections really is proportional to n−k, then when you plot the number of nodes with 1, 2, 3, … connections, the points should fall near a straight line when plotted on the log-log scale and the slope of this line should be –k.
In my experiment with 10,000 nodes, I got a line of slope −2.72 with a standard error of 0.04. Not exactly −3, but maybe the theoretical result only holds in the limit as the network becomes infinitely large. The points definitely fall near a straight line in log-log scale: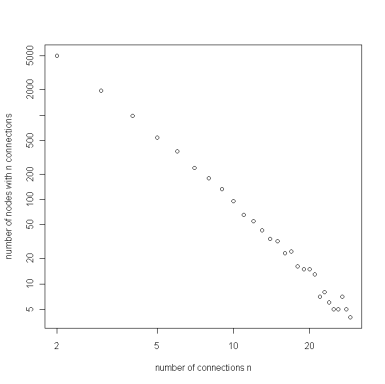
In this example, about half the nodes (5,073 out of 10,000) had only two connections. The average number of connections was 4, but the most connected node had 200 connections.
Note that the number of connections per node does not follow a bell curve at all. The standard deviation on the number of connections per node was 6.2. This means the node with 200 connections was over 30 standard deviations from the average. That simply does not happen with normal (Gaussian) distributions. But it’s not unusual at all for power law distributions because they have such thick tails.
Of course real networks are more complex than the model given here. For example, nodes add links over time, not just when they join a network. Barabási discusses in his book how some elaborations of the original model still produce power laws (possibly with different exponents) and while others do not.
Interesting! If I get time I’d like to try having a ceiling on the number of connections, as in practice one person cannot know (for any reasonable definition) an unlimited number of others, and a street network or even airport network can have even fewer node-node connections.
Yes, there’s a cost to maintain links in many natural and engineered systems. For instance, if there are communities and circles of friends, they don’t count much and don’t exert much influence if they aren’t nudged and spoken to for long periods of time. A network hub can’t have arbitrarily many connections, even if a scaled-up version of the hub (think Google) can serve a bunch.
But, OTOH, there are counterintuitive phenomena as well, perhaps not really networks, but phenomena of large scale synchronization. There’s a report in a recent issue of Science which addresses “Dynamical Quorum Sensing and Synchronization in Large Populations of Chemical Oscillators” where it seems easier to get components to communicate the more there are. This seems like a network effect although I don’t know whether or not there are actual links in these collections.