I’ve been doing some work with Focused Objective lately, and today the following question came up in our discussion. If you’re sampling from a uniform distribution, how many samples do you need before your sample range has an even chance of covering 90% of the population range?
This is a variation on a problem I’ve blogged about before. As I pointed out there, we can assume without loss of generality that the samples come from the unit interval. Then the sample range has a beta(n − 1, 2) distribution. So the probability that the sample range is greater than a value c is

Setting c = 0.9, here’s a plot of the probability that the sample range contains at least 90% of the population range, as a function of sample size.
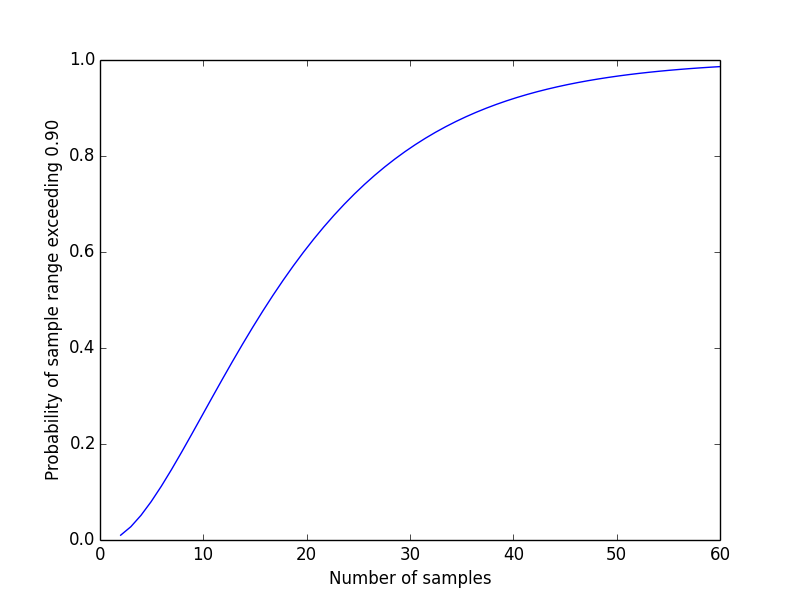
The answer to the question at the top of the post is 16 or 17. These two values of n yield probabilities 0.485 and 0.518 respectively. This means that a fairly small sample is likely to give you a fairly good estimate of the range.
I did some checks and computations with this, and a derivation of the formula on:
http://observations.rene-grothmann.de/distribution-of-minima-and-maxima-and-spreads/
How does this result generalise to more dimensions?
I’m wondering, and I believe, that the formulation also assumes nothing whatsoever is known about the values in the population or how they are generated. That’s a fairly stringent assumption. It’s delicate to straddle the line between a result which does not have to know something to get a bound, and one which simply ignores any additional information at hand. For me, when solving problems, I prefer to follow one of Polya’s dictums and use all the information on hand, even if it makes the analysis not so neat.
The sample range is a downward biased estimator of the population range here (since the biggest the sample range can *possibly* be is the population range). In practice, you would scale the sample range up by whatever factor makes it unbiased (something like (n+2)/(n+1)).