Suppose you fill the components of a matrix with random values. How are the eigenvalues distributed?
We limit our attention to large, symmetric matrices. We fill the entries of the matrix on the diagonal and above the diagonal with random elements, then fill in the elements below the diagonal by symmetry.
If we choose our random values from a thin-tailed distribution, then Wigner’s semicircle law tells us what to expect from our distribution. If our matrices are large enough, then we expect the probability density of eigenvalues to be semicircular. To illustrate this, we’ll fill a matrix with samples from a standard normal distribution and compute its eigenvalues with the following Python code.
      import numpy as np
      import matplotlib.pyplot as plt

      N = 5000
      A = np.random.normal(0, 1, (N, N))
      B = (A + A.T)/np.sqrt(2)
      eigenvalues = np.linalg.eigvalsh(B)
      print(max(eigenvalues), min(eigenvalues))

      plt.hist(eigenvalues, bins=70)
      plt.show()
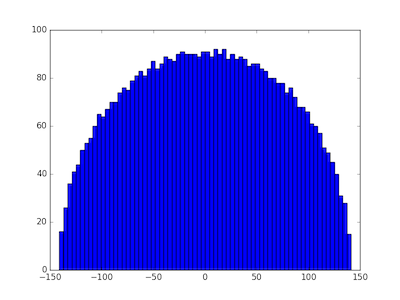
We first create an N by N non-symmetric matrix, then make it symmetric by adding it to its transpose. (That’s easier than only creating the upper-triangular elements.) We divide by the square root of 2 to return the variance of each component to its original value, in this case 1. The eigenvalues in this particular experiment ran from −141.095 to 141.257 and their histogram shows the expected semi-circular shape.
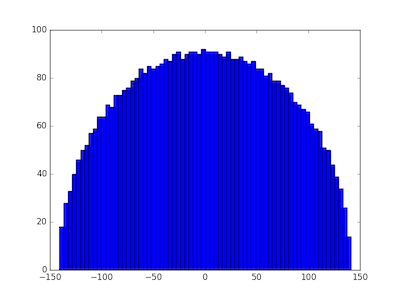
Wigner’s semicircle law does not require the samples to come from a normal distribution. Any distribution with finite variance will do. We illustrate this by replacing the normal distribution with a Laplace distribution with the same variance and rerunning the code. That is, we change the definition of the matrix A to
A = np.random.laplace(0, np.sqrt(0.5), (N, N))
and get very similar results. The eigenvalues ran from −140.886 to 141.514 and again we see a semicircular distribution.
But what happens when we draw samples from a heavy-tailed distribution, i.e. one without finite variance? We’ll use a Student-t distribution with ν = 1.8 degrees of freedom. When ν > 2 the t-distribution has variance ν/(ν − 2), but for smaller values of ν it has no finite variance. We change the definition of the matrix A to the following:
A = np.random.standard_t(1.8, (N, N))
and now the distribution is quite different.
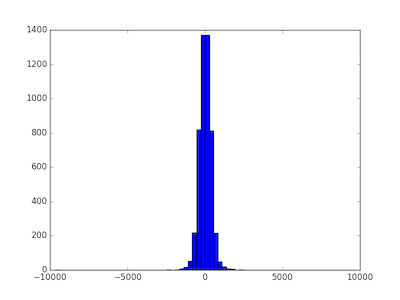
In this case the minimum eigenvalue was −9631.558 and the largest was 9633.853. When the matrix components are selected from a heavy-tailed distribution, the eigenvalues also have a heavier-tailed distribution. In this case, nearly all the eigenvalues are between -1000 and 1000, but the largest and smallest were 10 times larger. The eigenvalues are more variable, and their distribution looks more like a normal distribution and less like a semicircle.
The distributions for all thin-tailed symmetric matrices are the same. They have a universal property. But each heavy-tailed distribution gives rise to a different distribution on eigenvalues. With apologies to Tolstoy, thin-tailed matrices are all alike; every thick-tailed matrix is thick-tailed in its own way.
Update: As the first comment below rightfully points out, the diagonal entries should be divided by 2, not sqrt(2). Each of the off-diagonal elements of A + AT are the sum of two independent random variables, but the diagonal elements are twice what they were in A. To put it another way, the diagonal elements are the sum of perfectly correlated random variables, not independent random variables.
I reran the simulations with the corrected code and it made no noticeable difference, either to the plots or to the range of the eigenvalues.
Slight code quibble: the diagonal entries need to be divided by 2, not sqrt(2).
Is there an analogous statement for nonsymmetric matrices?
That’s quite a drastic change! It would be interesting to see what happens closer to the boundary, closer to nu = 2…
Aaron: I’m not familiar with the non-symmetric case. I wouldn’t be surprised if it’s much more complicated.
I tried just looking at the eigenvalues of A and the real and imaginary parts both look semicircular (except perhaps with higher variance; it’s hard to say for sure if they really are just from a graph). More convincing: I did a complex scatter plot, and sure enough, a perfect, apparently evenly distributed circle.
Interesting note when playing with this: it is unnecessary to create B. eigenvalsh assumes that the matrix is symmetric, so it ignores the lower triangular portion of the array (that is, eigenvalsh(A) works and gives the same thing as eigenvalsh(B)).
Hi, here is a paper I coauthored on the non symmetric case. It contains also the relevant reference for the symmetric case. http://front.math.ucdavis.edu/1006.1713
Ah, so it is a circle, with radius sqrt(5000) ≈ 70.
Hi, it depends on the index a of the heavy tail: once the matrix entries are rescaled by n^{1/2}, if a>2 then one has the usual circular law (uniform distribution over a disk); if 0<a<2 instead then one has a different law mu_a in the complex plane, that depends only on a (and not on the particular choice of the heavy tailed random variables with that index). An interesting point is that in contrast with the heavy tailed hermitian case the new law mu_a does not have heavy tails.
Hi John, Thanks for the post.
Thinking about covariance matrices, it seems to me that in order for eigenvalues to be distributed NOT according to the semi-circle law, the “original” matrix (the one for which the covariance matrix is created) should have particularely nasty behaviour. Perhaps such that the fourth moment of the distribution of original series (say time series) does not exist. Most often, this is not the case – i.e. the semi-circle law holds. Can we assume that?