I wrote a blog post of sorts, spread over several tweets, about plotting functions of a complex variable.
Plot of cosine over a square centered at the origin of the complex plane.
Color = phase. Height = magnitude. pic.twitter.com/rOT7tAkfM9— Analysis Fact (@AnalysisFact) February 11, 2020
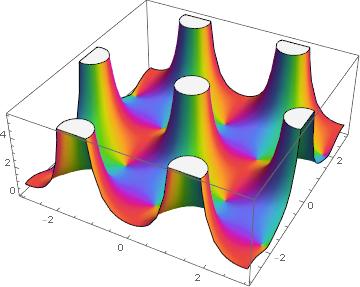
Here are a couple of the images from the tweet stream. First Weierstrass’s elliptic function.
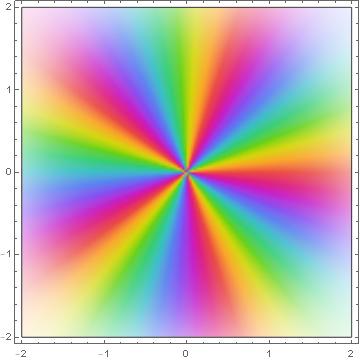
And a phase plot for z5.
Very nice! Do you know of a way to do that as easily and prettily in matplotlib?
See this post for a way to make phase plots in Python. I don’t know about 3D plots.
@Peter Aschbauer [cplot](https://github.com/nschloe/cplot) (a package of mine) plots these in matplotlib.